- 1. Microservices for Java Developers
- 2. Spring Boot for Microservices
- 3. Eclipse MicroProfile for Microservices
- 4. API Gateway with Apache Camel
- 5. Deploying Microservices at Scale with Docker and Kubernetes
- 6. Hands-on Cluster Management, Failover, and Load Balancing
- 7. Distributed Tracing with OpenTracing
- 8. Where Do We Go from Here?
Microservices for Java Developers
Second Edition
A Hands-on Introduction to Frameworks and Containers
Microservices for Java Developers
Copyright © 2019 Red Hat, Inc. All rights reserved.
Printed in the United States of America.
Published by O’Reilly Media, Inc. , 1005 Gravenstein Highway North, Sebastopol, CA 95472.
O’Reilly books may be purchased for educational, business, or sales promotional use. Online editions are also available for most titles ( http://oreilly.com ). For more information, contact our corporate/institutional sales department: 800-998-9938 or corporate@oreilly.com .
- Acquisitions Editor: Mary Treseler
- Developmental Editors: Chris Guzikowski and Eleanor Bru
- Production Editor: Nan Barber
- Copyeditor: Rachel Head
- Proofreader: Nan Barber
- Interior Designer: David Futato
- Cover Designer: Karen Montgomery
- Illustrator: Rebecca Demarest
- April 2019: Second Edition
Revision History for the Second Edition
- 2019-03-28: First Release
- 2019-06-17: Second Release
The O’Reilly logo is a registered trademark of O’Reilly Media, Inc. Microservices for Java Developers , the cover image, and related trade dress are trademarks of O’Reilly Media, Inc.
The views expressed in this work are those of the authors, and do not represent the publisher’s views. While the publisher and the authors have used good faith efforts to ensure that the information and instructions contained in this work are accurate, the publisher and the authors disclaim all responsibility for errors or omissions, including without limitation responsibility for damages resulting from the use of or reliance on this work. Use of the information and instructions contained in this work is at your own risk. If any code samples or other technology this work contains or describes is subject to open source licenses or the intellectual property rights of others, it is your responsibility to ensure that your use thereof complies with such licenses and/or rights.
This work is part of a collaboration between O’Reilly and Red Hat. See our statement of editorial independence .
978-1-492-03828-3
[LSI]
Chapter 1. Microservices for Java Developers
What Can You Expect from This Report?
This report is for Java developers and architects interested in developing microservices. We start the report with a high-level introduction and take a look at the fundamental prerequisites that should be in place to be successful with a microservices architecture. Unfortunately, just using new technology doesn’t magically solve distributed systems problems. Therefore, in this chapter we also explore some of the forces involved and what successful companies have done to make microservices work for them, including aspects such as culture, organizational structure, and market pressures. Then we take a deep dive into a few Java frameworks for implementing microservices. The accompanying source code repository can be found on GitHub . Once we have our hands dirty, we’ll come back up for air and discuss issues around deployment, clustering, and failover, and how Docker and Kubernetes deliver solutions in these areas. Then we’ll get back into the details with some hands-on examples with Docker, Kubernetes, and OpenShift to demonstrate the power they bring to cloud-native microservices architectures. The last chapter offers some thoughts on topics that we cannot cover in this report but that are nonetheless important, like configuration, logging, and continuous delivery.
Transitioning to microservices involves more than just a technological change. Implementations of microservices have roots in complex adaptive theory, service design, technology evolution, domain-driven design, dependency thinking, promise theory, and other areas. They all come together to allow the people in an organization to truly exhibit agile, responsive learning behaviors and to stay competitive in a fast-evolving business world. Let’s take a closer look.
You Work for a Software Company
Software really is eating the world. Businesses are slowly starting to realize this, and there are two main drivers for this phenomenon: delivering value through high-quality services and the rapid commoditization of technology. This report is primarily written in a hands-on, by-example format. But before we dive into the technology, we need to properly set the stage and understand the forces at play. We have been talking ad nauseam in recent years about making businesses agile , but we need to fully understand what that means. Otherwise it’s just a nice platitude that everyone glosses over.
The Value of Service
For more than 100 years, our business markets have been about creating products and driving consumers to want those products: desks, microwaves, cars, shoes, whatever. The idea behind this “producer-led” economy comes from Henry Ford’s theory that if one could produce great volumes of a product at low cost, the market would be virtually unlimited. For that to work, you also need a few one-way channels to directly market to the masses to convince them that they need these products and their lives will be substantially better with them. For most of the 20th century, these one-way channels existed in the form of advertisements on TV, in newspapers and magazines, and on highway billboards. However, this producer-led economy has been flipped on its head because markets are fully saturated with products (how many phones/cars/TVs do you need?). Further, the internet, along with social networks, is changing the dynamics of how companies interact with consumers (or more importantly, how consumers interact with them).
Social networks allow us, as consumers, to more freely share information with one another and the companies with which we do business. We trust our friends, family, and others more than we trust marketing departments. That’s why we go to social media outlets to choose restaurants, hotels, and airlines. Our positive feedback in the form of reviews, tweets, shares, and the like can positively favor the brand of a company, and our negative feedback can just as easily and very swiftly destroy a brand. As depicted in Figure 1-1 , there is now a powerful bidirectional flow of information between companies and their consumers that previously never existed, and businesses are struggling to keep up with the impact of not owning their brands.
Postindustrial companies are learning they must nurture their relationships (using bidirectional communication) with customers to understand how to bring value to them. Companies do this by providing ongoing conversation through service, customer experience, and feedback. Customers choose which services to consume and which to pay for depending on which ones bring them value and good experiences. Take Uber, for example, which doesn’t own any inventory or sell products per se. You don’t get any value out of sitting in someone else’s car, but you may be trying to get somewhere that does bring value (a business meeting, for example). In this way, using Uber’s service creates value. Going forward, companies will need to focus on bringing valuable services to customers, and technology will drive this through digital services.
The Commoditization of Technology
Technology follows a similar boom-and-bust cycle as economics, biology, and law. It has led to great innovations, like the steam engine, the telephone, and the computer. In our competitive markets, however, game-changing innovations require a lot of investment and build-out to quickly capitalize. This brings more competition, greater capacity, and falling prices, eventually making the once-innovative technology a commodity. Upon these commodities we continue to innovate and differentiate, and the cycle continues. This commoditization has brought us from the mainframe to the personal computer to what we now call “cloud computing,” which is a service bringing us commodity computing with almost no upfront capital expenditure. On top of cloud computing, we’re now seeing new innovation in the form of digital services. Figure 1-2 shows the value over time curve.
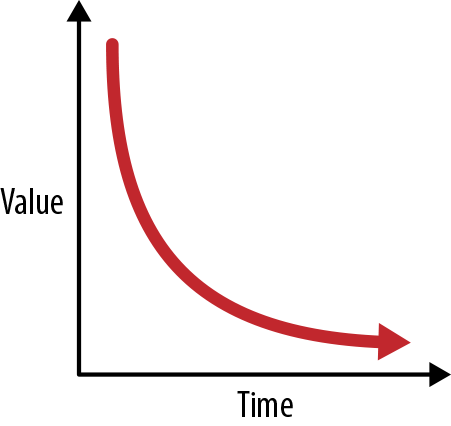
Figure 1-2. The value over time curve
Open source is also leading the charge in the technology space. Following the commoditization curve, open source is a place developers can go to challenge proprietary vendors by building and innovating on software that was once only available (without source, no less) with high license costs. This drives communities to build things like operating systems (Linux), programming languages (Go), message queues (Apache ActiveMQ), and web servers ( httpd ). Even companies that originally rejected open source are starting to come around by open sourcing their technologies and contributing to existing communities. As open source and open ecosystems have become the norm, we’re starting to see a lot of the innovation in software technology coming directly from open source communities (e.g., Apache Spark, Docker, and Kubernetes).
Disruption
The confluence of these two factors—service design and technology evolution—is lowering the barrier of entry for anyone with a good idea to start experimenting and trying to build new services. You can learn to program, use advanced frameworks, and leverage on-demand computing for next to nothing. You can post to social networks, blog, and carry out bidirectional conversations with potential users of your service for free. With the fluidity of our business markets, any over-the-weekend startup can put a legacy company out of business.
And this fact scares most CIOs and CEOs. As software quickly becomes the mechanism by which companies build digital services and experiences and differentiate themselves, many are realizing that they must become software companies in their respective verticals. Gone are the days of massive outsourcing and treating IT as a commodity or cost center. For companies to stay truly competitive, they must embrace software as a differentiator, and to do that, they must embrace organizational agility.
Embracing Organizational Agility
Companies in the industrial-era thinking of the 20th century are not built for agility. They are built to maximize efficiencies, reduce variability in processes, and eliminate creative thinking in workers, placing them into boxes the way you would organize an assembly line. They are built like machines to take inputs, apply a highly tuned process, and create outputs. They are structured with top-down hierarchical management to facilitate this machine-like thinking. Changing the machine requires 18-month planning cycles. Information from the edges goes through many layers of management and translation to get to the top, where decisions are made and handed back down. This organizational approach works great when creating products and trying to squeeze every bit of efficiency out of a process, but does not work for delivering services. Figure 1-3 illustrates the relation between efficiency and flexibility.

Figure 1-3. Relation between efficiency and flexibility
Customers don’t fit in neat boxes or processes. They show up whenever they want. They want to talk to a customer service representative, not an automated phone system. They ask for things that aren’t on the menu. They need to input something that isn’t on the form. Customers want convenience. They want a conversation. And they get mad if they have to wait.
This means our customer-facing services need to account for variability. They need to be able to react to the unexpected. This is at odds with efficiency. Customers want to have a conversation through a service you provide them, and if that service isn’t sufficient for solving their needs, you need loud, fast feedback about what would help solve their needs and what’s getting in their way. This feedback can be used by the maintainers of the service to quickly adjust the service and interaction models to better suit users. You cannot wait for decisions to bubble up to the top and go through lengthy planning cycles; you need to make decisions quickly with the information you have at the edges of your business. You need autonomous, purpose-driven, self-organizing teams that are responsible for delivering a compelling experience to consumers (paying customers, business partners, peer teams, etc.). Rapid feedback cycles, autonomous teams, shared purpose, and conversation are the prerequisites that organizations must embrace to be able to navigate and live in a postindustrial, unknown, uncharted world of business disruption.
No book on microservices would be complete without quoting Conway’s law: “Organizations which design systems…are constrained to produce designs which are copies of the communication structures of these organizations.”
To build agile software systems, we must start with building agile organizational structures. This structure will facilitate the prerequisites we need for microservices, but what technology do we use? Building distributed systems is hard, and in the subsequent sections, we’ll take a look at the problems you must keep in mind when building and designing these services.
What Is a Microservices Architecture?
A microservices architecture (MSA) is an approach to building software systems that decomposes business domain models into smaller, consistently bounded contexts implemented by services. These services are isolated and autonomous yet communicate to provide some piece of business functionality. Microservices are typically implemented and operated by small teams with enough autonomy that each team and service can change the details of its internal implementation (including replacing it outright!) with minimal impact across the rest of the system. Figure 1-4 illustrates how having independent teams aids agility.

Figure 1-4. Independent teams aid agility
Teams communicate through promises , which are a way a service can publish intentions to other components or systems that may wish to use the service. They specify these promises with interfaces of their services and via wikis that document their services. If there isn’t enough documentation, or the API isn’t clear enough, the service provider hasn’t done their job. (There’ll be a little more on promises and promise theory in the next section.)
Each team is responsible for designing its service, picking the right technology for the problem set, deploying and managing the service, and waking up at 2 a.m. to deal with any issues. For example, at Amazon, there is a single team that owns the tax calculation functionality that gets called during checkout. The models within this service (item, address, tax, etc.) are all understood to mean “within the context of calculating taxes” for a checkout; there is no confusion about these objects (e.g., is the item a return item or a checkout item?). The team that owns the tax calculation service designs, develops, and operates this service. Amazon has the luxury of a mature set of self-service tools to automate a lot of the build/deploy/operate steps, but we’ll come back to that.
With microservices, we can scope the boundaries of a service, which helps us:
-
Understand what the service is doing without getting tangled up in other concerns in a larger application.
-
Quickly build the service locally.
-
Pick the right technology for the problem (lots of writes? lots of queries? low latency? bursty?).
-
Test the service.
-
Build/deploy/release at the cadence necessary for the business, which may be independent of that of other services.
-
Identify and horizontally scale parts of the architecture where needed.
-
Improve the resiliency of the system as a whole.
MSA helps solve the problem of how we decouple our services and teams to move quickly at scale. It allows teams to focus on providing the services and making changes when necessary, and to do so without costly synchronization points. Here are some things you won’t hear about once you’ve adopted microservices:
-
Jira tickets
-
Unnecessary meetings
-
Shared libraries
-
Enterprise-wide canonical models
Is a microservices architecture right for you? Microservices have a lot of benefits, but they come with their own set of drawbacks. You can think of microservices as an optimization for problems that require the ability to change things quickly at scale, but with a price. This approach is not efficient. It can be more resource-intensive. You may end up with what looks like duplication. Operational complexity is a lot higher. It becomes very difficult to understand the system holistically. It becomes significantly harder to debug problems. In some areas you may have to relax the notion of a transaction. Teams may not have been designed to work like this.
Not every part of the business has to be able to change on a dime. A lot of customer-facing applications do. Backend systems may not. But as those two worlds start to blend together, we may see the forces that justify microservices architectures push to other parts of the system.
Challenges
Designing cloud-native applications following a microservices approach requires thinking differently about how to build, deploy, and operate them. We can’t simply build our application thinking we know all the ways it will fail and then just prevent those. In complex systems like those built with microservices, we must be able to deal with uncertainty. This section will identify five main things to keep in mind when developing microservices.
Design for Faults
In complex systems, things fail. Hard drives crash, network cables get unplugged, we do maintenance on the live database instead of the backups, and virtual machines (VMs) disappear. Single faults can be propagated to other parts of the system and result in cascading failures that take an entire system down.
Traditionally, when building applications, we’ve tried to predict what pieces of our app (e.g., n -tier) might fail and build up a wall big enough to keep them from failing. This mindset is problematic at scale because we cannot always predict what things can go wrong in complex systems. Things will fail, so we must develop our applications to be resilient and handle failure, not just prevent it. We should be able to deal with faults gracefully and not let faults propagate to total failure of the system.
Building distributed systems is different from building shared-memory, single-process, monolithic applications. One glaring difference is that communication over a network is not the same as a local call with shared memory. Networks are inherently unreliable. Calls over the network can fail for any number of reasons (e.g., signal strength, bad cables/routers/switches, and firewalls), and this can be a major source of bottlenecks. Not only does network unreliability have performance implications with regard to response times to clients of your service, but it can also contribute to upstream systems failure.
Latent network calls can be very difficult to debug; ideally, if your network calls cannot complete successfully, they fail immediately, and your application notices quickly (e.g., through
IOException
). In this case, you can
quickly take corrective action, provide degraded functionality, or just
respond with a message stating the request could not be completed
properly and that users should try again later. But errors in network requests or
distributed applications aren’t always that easy. What if the downstream
application you must call takes longer than normal to respond? This is
a killer because now your application must take into account this slowness
by throttling requests, timing out downstream requests, and potentially
stalling all calls through your service. This backup can cause upstream
services to experience slowdowns and even grind to a halt. And it can cause
cascading failures.
Design with Dependencies in Mind
To be able to move fast and be agile from an organizational or distributed systems standpoint, we have to design systems with dependency thinking in mind; we need loose coupling in our teams, our technology, and our governance. One of the goals with microservices is to take advantage of autonomous teams and autonomous services. This means being able to change things as quickly as the business needs without impacting the services around us or the system at large. It also means we should be able to depend on services, but if they’re not available or are degraded, we need to be able to handle this gracefully.
In his book Dependency-Oriented Thinking (InfoQ Enterprise Software Development Series), Ganesh Prasad hits it on the head when he says, “One of the principles of creativity is to drop a constraint . In other words, you can come up with creative solutions to problems if you mentally eliminate one or more dependencies.” The problem is that our organizations were built with efficiency in mind, and that brings along a lot of tangled dependencies.
For example, when you need to consult with three other teams to make a change to your service (DBA, QA, and security), this is not very agile; each one of these synchronization points can cause delays. It’s a brittle process. If you can shed those dependencies or build them into your team (you definitely can’t sacrifice safety or security, so you should build those components into your team), you’re free to be creative and more quickly solve problems that customers face or that the business foresees without costly people bottlenecks.
Another angle to the dependency management story is what to do with legacy systems. Exposing the details of backend legacy systems (COBOL copybook structures, XML serialization formats used by a specific system, etc.) to downstream systems is a recipe for disaster. Making one small change (customer ID is now 20 numeric characters instead of 16) now ripples across the system and invalidates assumptions made by those downstream systems, potentially breaking them. We need to think carefully about how to insulate the rest of the system from these types of dependencies.
Design with the Domain in Mind
Models have been used for centuries to simplify and understand a problem through a certain lens. For example, the GPS maps on our phones are great models for navigating a city while walking or driving, but this model would be completely useless to someone flying a commercial airplane. The models pilots use are more appropriate to describe waypoints, landmarks, and jet streams. Different models make more or less sense depending on the context from which they’re viewed. Eric Evans’s seminal book Domain-Driven Design (Addison-Wesley) helps us build models for complex business processes that can also be implemented in software. Ultimately the real complexity in software is not the technology but rather the ambiguous, circular, contradicting models that business folks sort out in their heads on the fly. Humans can understand models given some context, but computers need a little more help; these models and the context must be baked into the software. If we can achieve a level of modeling that is bound to the implementation (and vice versa), anytime the business changes, we can more clearly understand how that changes the software. The process we embark upon to build these models and the development of the language surrounding them takes time and requires fast feedback loops.
One of the tools Evans presents is identifying and explicitly separating the different models and ensuring they are each cohesive and unambiguous within their own bounded context ( Figure 1-5 ). Context mapping lets us visualize the relationships between those different contexts.

Figure 1-5. Bounded contexts
A bounded context is a set of domain objects that implement a model that
tries to simplify and communicate a part of the business, code, and
organization. Often, we strive for efficiency when designing our
systems when we really need flexibility (sound familiar?). In a simple
auto parts application, for example, we might try to come up with a unified “canonical model”
of the entire domain, and end up with objects like
Part
,
Price
,
and
Address
. If the inventory application used the
Part
object it
would be referring to a type of part, like a type of brake or wheel.
In an automotive quality assurance system,
Part
might refer to a very
specific part with a serial number and unique identifier to track
certain quality test results and so forth. We might try diligently to
efficiently reuse the same canonical model, but inventory
tracking and quality assurance are different business concerns that use
the
Part
object semantically differently. With a bounded context for the inventory system, a
Part
would explicitly be modeled as
PartType
and be understood
within that context to represent a “type of part,” not a specific
instance of a part. With two separate bounded contexts, these
Part
objects can evolve consistently within their own models without
depending on one another in weird ways, and thus we’ve achieved a level of
agility or flexibility. The context map is what allows us to keep track of the different contexts within the application, to prevent ambiguity.
This deep understanding of the domain takes time. It may take a few iterations to fully understand the ambiguities that exist in business models and properly separate them out and allow them to change independently. This is at least one reason starting off building microservices is difficult. Carving up a monolith is no easy task, but a lot of the concepts are already baked into the monolith; your job is to identify and separate them. With a greenfield project, you cannot carve up anything until you deeply understand the domain. In fact, all of the microservice success stories we hear about (like Amazon and Netflix) started out going down the path of the monolith before they successfully made the transition to microservices.
Design with Promises in Mind
In a microservices environment with autonomous teams and services, it’s very important to keep in mind the relationship between service provider and service consumer. As an autonomous service team, you cannot place obligations on other teams and services because you do not own them; they’re autonomous by definition. All you can do is choose whether or not to accept their promises of functionality or behavior. As a provider of a service to others, all you can do is promise them a certain behavior. They are free to trust you or not. Promise theory, a model first proposed by Mark Burgess in 2004 and covered in his book In Search of Certainty (O’Reilly), is a study of autonomous systems including people, computers, and organizations providing services to each other. Figure 1-6 illustrates the difference between an obligation and a promise: an obligation is placed on a team, while a promise is made by the team.

Figure 1-6. Obligation versus promise
In terms of distributed systems, promises help articulate what a service may provide and make clear what assumptions can and cannot be made. For example, suppose our team owns a book recommendation service, and we promise a personalized set of book recommendations for a specific user you ask about. What happens when you call our service, and one of our backends (the database that stores that user’s current view of recommendations) is unavailable? We could throw exceptions and stack traces back to you, but that would not be a very good experience and could potentially blow up other parts of the system. Because we made a promise, we can instead try to do everything we can to keep it, including returning a default list of books, or a subset of all the books. There are times when promises cannot be kept, and identifying the best course of action in these circumstances should be driven by the desired experience or outcome for our users. The key here is the onus on our service to try to keep its promise (return some recommendations), even if our dependent services cannot keep theirs (the database was down). In the course of trying to keep a promise, it helps to have empathy for the rest of the system and the service quality we’re trying to uphold.
Another way to look at a promise is as an agreed-upon exchange that provides value for both parties (like a producer and a consumer). But how do we go about deciding between two parties what is valuable and what promises we’d like to agree upon? If nobody calls our service or gets value from our promises, how useful is the service? One way of articulating the promises between consumers and providers is with consumer-driven contracts . With consumer-driven contracts, we are able to capture the value of our promises with code or assertions, and as a provider, we can use this knowledge to test whether we’re upholding our promises.
Distributed Systems Management
At the end of the day, managing a single system is easier than for a distributed one. If there’s just one machine, and one application server, and there are problems with the system, we know where to look. If we need to make a configuration change, upgrade to a specific version, or secure it, it’s all in one physical and logical location. Managing, debugging, and changing it is easier. A single system may work for some use cases, but for ones where scale is required, we may look to leverage microservices. As we discussed earlier, however, microservices are not free; the trade-off for having flexibility and scalability is having to manage a complicated system.
When it comes to managing a microservices deployment, here are some questions to consider:
-
How do we start and stop a fleet of services?
-
How do we aggregate logs/metrics/service level agreements (SLAs) across microservices?
-
How do we discover services in an elastic environment where they can be coming, going, moving, etc.?
-
How do we do load balancing?
-
How do we learn about the health of our cluster or individual services?
-
How do we restart services that have failed?
-
How do we do fine-grained API routing?
-
How do we secure our services?
-
How do we throttle or disconnect parts of a cluster if it starts to crash or act unexpectedly?
-
How do we deploy multiple versions of a service and route to them appropriately?
-
How do we make configuration changes across a large fleet of services?
-
How do we make changes to our application code and configuration in a safe, auditable, repeatable manner?
These are not easy problems to solve. The rest of this report will be devoted to getting Java developers up and running with microservices and able to solve some of the problems listed here.
Technology Solutions
Throughout the rest of the report, we’ll introduce you to some popular technology components and how they help solve some of the problems of developing and delivering software using a microservices architecture. As touched upon earlier, microservices aren’t just a technological problem, and getting the right organizational structure and teams in place to facilitate this approach is paramount. Switching from SOAP to REST doesn’t make a microservices architecture.
The first step for a Java development team creating microservices is to get something working locally on their machines. This report will introduce you to three opinionated Java frameworks for working with microservices: Spring Boot, MicroProfile, and Apache Camel. Each framework has upsides for different teams, organizations, and approaches to microservices. As is the norm with technology, some tools are a better fit for the job or team using them than others. Of course, these are not the only frameworks to use. There are a couple that take a reactive approach to microservices, like Vert.x and Lagom . The mindshift for developing with an event-based model is a bit different and requires a different learning curve, though, so for this report we’ll stick with a model that most enterprise Java developers will find comfortable.
If you want to know more about reactive programming and reactive microservices, you can download the free ebook Building Reactive Microservices in Java by Clement Escoffier from the Red Hat Developers website.
The goal of this report is to get you up and running with the basics for each framework. We’ll dive into a few advanced concepts in the last chapter, but for the first steps with each framework, we’ll assume a “Hello World” microservice application. This report is not an all-encompassing reference for developing microservices; each chapter ends with links to reference material that you can explore to learn more as needed. We will iterate on the Hello World application by creating multiple services and show some simple interaction patterns.
The final iteration for each framework will look at concepts like bulkheading and promise theory to make services resilient in the face of faults. We will dig into parts of the NetflixOSS stack, like Hystrix, that can make our lives easier when implementing this functionality. We will discuss the pros and cons of this approach and explore what other options exist.
First, though, let’s take a look at the prerequisites you’ll need to get started.
Preparing Your Environment
We will be using Java 1.8 for the examples in this report and building them with Maven. Please make sure for your environment you have the following prerequisites installed:
-
JDK 1.8
-
Maven 3.5+
-
Access to a command-line shell (bash, PowerShell, cmd, Cygwin, etc.)
The Spring ecosystem has some great tools you may wish to use either at the command line or in an IDE. Most of the examples will stick to the command line to stay IDE-neutral and because each IDE has its own way of working with projects. For Spring Boot, we’ll use the Spring Boot CLI 2.1.x .
Alternative IDEs and tooling for Spring, MicroProfile and Camel include:
Finally, when you build and deploy your microservices as Docker containers running inside of Kubernetes, you’ll want the following tools to bootstrap a container environment on your machines:
Chapter 2. Spring Boot for Microservices
Spring Boot is an opinionated Java framework for building microservices based on the Spring dependency injection framework. Spring Boot facilitates creation of microservices through reduced boilerplate, configuration, and developer friction. This is a similar approach to the two other frameworks we’ll look at.
Advantages of Spring Boot
Spring Boot offers the following advantages in comparison to the Spring framework:
-
Favoring automatic, conventional configuration by default
-
Curating sets of popular starter dependencies for easier consumption
-
Simplifying application packaging
-
Baking in application insight (e.g., metrics and environment info)
Simplified Configuration
Spring historically was a nightmare to configure. Although the framework
improved upon other high-ceremony component models (EJB 1.x, 2.x, etc.),
it did come along with its own set of heavyweight usage patterns.
Namely, Spring required a lot of XML configuration and a deep
understanding of the individual beans needed to construct
JdbcTemplates
,
JmsTemplates
,
BeanFactory
lifecycle hooks, servlet listeners, and many
other components. In fact, writing a simple “Hello World” with Spring MVC required understanding of DispatcherServlet and a whole host of
Model–View–Controller classes. Spring Boot aims to eliminate all of this
boilerplate configuration with some implied conventions and simplified
annotations—although, you can still finely tune the underlying beans
if you need to.
Starter Dependencies
Spring was used in large enterprise applications that typically leveraged lots of different technologies to do the heavy lifting: JDBC databases, message queues, file systems, application-level caching, etc. Developers often had to stop what they were doing, switch cognitive contexts, figure out what dependencies belonged to which piece of functionality (“Oh, I need the JPA dependencies!”), and spend lots of time sorting out versioning mismatches and other issues that arose when trying to use these various pieces together. Spring Boot offers a large collection of curated sets of libraries for adding these pieces of functionality. These starter modules allow you to add things like:
-
Java Persistence API (JPA)
-
NoSQL databases like MongoDB, Cassandra, and Couchbase
-
Redis caching
-
Tomcat/Jetty/Undertow servlet engines
-
Java Transaction API (JTA)
Adding a submodule to an application brings in a curated set of transitive dependencies and versions that are known to work together, saving developers from having to sort out dependencies themselves.
Application Packaging
Spring Boot really is a set of bootstrap libraries with some convention
for configurations, but there’s no reason why you couldn’t run a Spring
Boot application inside your existing application servers as a Web Application Archive (WAR). The idiom that most developers who use Spring Boot prefer for their applications is the self-contained Java Archive (JAR) packaging, where all dependencies and application code are bundled together with a flat class loader in a single JAR. This makes it easier to understand application startup, dependency ordering, and log statements. More importantly, it also helps reduce the
number of moving pieces required to take an app safely to production.
You don’t take an app and chuck it into an app server; the
app, once it’s built, is ready to run as is—standalone—including
embedding its own servlet container if it uses servlets. That’s right, a
simple
java -jar
<name.jar>
is enough to start your application now!
Spring Boot, MicroProfile/Thorntail, and many other frameworks like Vert.x and Dropwizard all follow this pattern of
packaging everything into an executable uber-AR.
But what about the management things we typically expect out of an application server?
Production-Ready Features
Spring Boot ships with a module called
spring boot actuator
that enables things
like metrics and statistics about your application. For example, you can
collect logs, view metrics, perform thread dumps, show environment
variables, understand garbage collection, and show which beans are configured
in the BeanFactory. You can expose this information via HTTP or Java Management Extensions (JMX), or you can even log in directly to the process via SSH.
With Spring Boot, you can leverage the power of the Spring framework and reduce boilerplate configuration and code to more quickly build powerful, production-ready microservices. Let’s see how.
Getting Started
We’re going to use the Spring Boot command-line interface (CLI) to bootstrap our first Spring Boot application (the CLI uses Spring Initializr under the covers). You are free to explore the different ways to do this if you’re not comfortable with the CLI. Alternatives include using Spring Initializr plug-ins for your favorite IDE, or using the web version . The Spring Boot CLI can be installed a few different ways, including through package managers and by downloading it straight from the website. Check for instructions on installing the CLI most appropriate for your development environment .
Once you’ve installed the CLI tools, you should be able to check the version of Spring you have:
$ spring --version

Spring CLI v2.1.1.RELEASE
If you can see a version for your installation of the CLI, congrats! Now navigate to the directory where you want to host your examples from the report and run the following command:
$ spring init --build maven --groupId com.redhat.examples \
  --version 1.0 --java-version 1.8 --dependencies web \
  --name hello-springboot  hello-springboot
After running this command, you should have a directory named hello-springboot with a complete Spring Boot application. If you run the command and end up with a demo.zip , then just unzip it and continue. Let’s take a quick look at what those command-line options are:
-
--build -
The build management tool we want to use.
mavenandgradleare the two valid options at this time. -
--groupId -
The
groupIdto use in our Maven coordinates for our pom.xml . Unfortunately this does not properly extend to the Java package names that get created; these need to be modified by hand. -
--version -
The version of our application. This will be used in later iterations, so set to 1.0.
-
--java-version -
The build compiler version for the JDK.
-
--dependencies -
This is an interesting parameter; we can specify fully baked sets of dependencies for doing common types of development. For example,
webwill set up Spring MVC and embed an internal servlet engine (Tomcat by default, Jetty and Undertow as options). Other convenient dependency bundles/starters includejpa,security, andcassandra).
Now, from the hello-springboot directory, try running the following command:
$ mvn spring-boot:run
If everything boots up without any errors, you should see some logging similar to this:
2018-12-13 13:18:19 ---[main]TomcatWebServer : Tomcat started on port(s):8080(http)with context path''2018-12-13 13:18:19 ---[main]HelloSpringbootApplication : Started HelloSpringbootApplication in 2.3 seconds(JVM runningfor10.265)
Congrats! You have just gotten your first Spring Boot application up and running. If you navigate to http://localhost:8080 in your browser, you should see the output shown in Figure 2-1 .

Figure 2-1. Whitelabel error page
This default error page is expected since our application doesn’t do anything yet. Let’s move on to the next section to add a REST endpoint to put together a Hello World use case.
Hello World
Now that we have a Spring Boot application that can run, let’s add some
simple functionality. We want to expose an HTTP/REST endpoint at
/api/hello
that will return “Hello Spring Boot from
X
" where
X
is the IP
address where the service is running. To do this, navigate to
src/main/java/com/examples/hellospringboot
. This location should have been created for
you if you followed the preceding steps. Then create a new Java class called
HelloRestController
, as shown in
Example 2-1
. We’ll add a method named
hello()
that returns a string along with the IP address of where the service is running. You’ll see in
Chapter 6
, when we discuss load balancing and service discovery, how the host IPs can be used to demonstrate proper failover, load balancing, etc.
Example 2-1. src/main/java/com/examples/hellospringboot/HelloRestController.java
publicclassHelloRestController{publicStringhello(){Stringhostname=null;try{hostname=InetAddress.getLocalHost().getHostAddress();}catch(UnknownHostExceptione){hostname="unknown";}return"Hello Spring Boot from "+hostname;}}
Add the HTTP Endpoints
At this point, this piece of code is just a POJO (plain old Java object), and you could (and should) write a unit test that verifies its behavior. To expose this as a REST endpoint, we’re going to make use of the following annotations in Example 2-2 :
-
@RestController -
Tells Spring this is an HTTP controller capable of exposing HTTP endpoints (GET, PUT, POST, etc.)
-
@RequestMapping -
Maps specific parts of the HTTP URI path to classes, methods, and parameters in the Java code
Note that import statements are omitted.
Example 2-2. src/main/java/com/examples/hellospringboot/HelloRestController.java
@RestController@RequestMapping("/api")publicclassHelloRestController{@RequestMapping(method=RequestMethod.GET,value="/hello",produces="text/plain")publicStringhello(){Stringhostname=null;try{hostname=InetAddress.getLocalHost().getHostAddress();}catch(UnknownHostExceptione){hostname="unknown";}return"Hello Spring Boot from "+hostname;}}
In this code, all we’ve done is add the aforementioned annotations. For
example,
@RequestMapping("/api")
at the class level says “map any
method-level HTTP endpoints under this root URI path.” When we add
@RequestMapping(method = RequestMethod.GET, value = "/hello", produces = "text/plain")
, we are telling Spring to expose an HTTP GET endpoint at
/hello
(which will really be
/api/hello
) and map requests with a media type of
Accept: text/plain
to this method. Spring Boot defaults to using an
embedded Tomcat servlet container, but this can be switched to other
options like Undertow or Jetty.
If you build the application and run
spring-boot:run
again, you should
be able to reach your HTTP endpoint:
$ mvn clean spring-boot:run
Now if you point your browser to http://localhost:8080/api/hello , you should see a response similar to Figure 2-2 .

Figure 2-2. Successful hello
What if we want to add some environment-aware configuration to our application? For example, instead of saying “Hello,” maybe you want to say “Guten Tag” if we deploy our app in production for German users. We need a way to inject properties into our app.
Externalize Configuration
Spring Boot makes it easy to use external property sources like
properties files, command-line arguments, the OS environment, or Java
system properties. We can even bind entire “classes” of properties to
objects in our Spring context. For example, if we want to bind all
helloapp.*
properties to the
HelloRestController
, we can add
@ConfigurationProperties(prefix="helloapp")
, and Spring Boot will
automatically try to bind
helloapp.foo
and
helloapp.bar
to Java Bean
properties in the
HelloRestController
class. We can define new
properties in
src/main/resources/application.properties
. The
application.properties
file was automatically
created for us when we created our project. (Note that we could change the
filename to
application.yml
and Spring would still recognize the
YAML file as the source of properties.)
Let’s add a new property to our src/main/resources/application.properties file:
helloapp.saying=Guten Tag aus
Next we add the
@ConfigurationProperties
annotation and our new
saying
field to the
HelloRestController
class, as shown in
Example 2-3
. Note we also need setters.
Example 2-3. src/main/java/com/examples/hellospringboot/HelloRestController.java
@RestController@RequestMapping("/api")@ConfigurationProperties(prefix="helloapp")publicclassHelloRestController{privateStringsaying;@RequestMapping(method=RequestMethod.GET,value="/hello",produces="text/plain")publicStringhello(){Stringhostname=null;try{hostname=InetAddress.getLocalHost().getHostAddress();}catch(UnknownHostExceptione){hostname="unknown";}returnsaying+" "+hostname;}publicvoidsetSaying(Stringsaying){this.saying=saying;}}
Stop the application from running (if you haven’t already) and restart it:
$ mvn clean spring-boot:run
Now if you navigate to http://localhost:8080/api/hello , you should see the German version of the saying as shown in Figure 2-3 .

Figure 2-3. Successful German greeting
We can now externalize properties that will change depending on the environment in which we are running. Things like service URIs, database URIs and passwords, and message queue configurations would all be great candidates for external configuration. Don’t overdo it, though; not everything needs to change depending on the environment! Ideally an application would be configured exactly the same in all environments, including timeouts, thread pools, retry thresholds, etc.
Expose Application Metrics and Information
If we want to put this microservice into production, how will we monitor
it? How can we get any insight about how things are running? Often
our microservices are black boxes unless we explicitly think through how
we want to expose metrics to the outside world. Fortunately, Spring Boot comes with a
prepackaged starter (
spring-boot-starter-actuator
) that makes doing this a breeze.
Let’s see what it takes to enable the actuator. Open up the
pom.xml
file for your
hello-springboot
microservice and add the following Maven
dependency in the
<dependencies>...</dependencies>
section:
<dependency><groupId>org.springframework.boot</groupId><artifactId>spring-boot-starter-actuator</artifactId></dependency>
Because we’ve added the actuator dependency, our application now can expose a lot of information that will be very handy for debugging or general microservice insight.
Not all endpoints provided by the actuator dependency are exposed by default, however. We need to manually specify which endpoints will be exposed.
Add the following property to src/main/resources/application.properties to expose some technology-agnostic endpoints:
#Enablemanagementendpointsmanagement.endpoints.web.exposure.include=beans,env,health,metrics,httptrace,mappings
Now restart your microservice by stopping it and running:
$ mvn clean spring-boot:run
Try hitting the following URLs and examine what gets returned:
-
http://localhost:8080/actuator/beans
-
http://localhost:8080/actuator/env
-
http://localhost:8080/actuator/health
-
http://localhost:8080/actuator/metrics
-
http://localhost:8080/actuator/httptrace
-
http://localhost:8080/actuator/mappings
Figure 2-4 shows an example of what the http://localhost:8080/env endpoint looks like.

Figure 2-4. Actuator response
Exposing runtime insights like this frees up the developer to just focus on writing code for the microservice that delivers business value. Delegating the heavy lifting and boilerplate to frameworks is definitely a good idea.
Running Outside of Maven
Up to this point we’ve been thinking about development and building our Hello World microservice from the perspective of a developer’s laptop using Maven. But what if you want to distribute your microservice to others or run it in a live environment (development, QA, production)?
Luckily, with Spring Boot it only takes a few steps to get
ready for shipment and production. Spring Boot prefers atomic, executable JARs with all dependencies packed into a flat classpath. This means the JAR that we create as part of a call to
mvn clean package
is
executable and contains all we need to run our microservice in a Java
environment. To test this out, go to the root of the
hello-springboot
microservice project and run the following commands:
$ mvn clean package
$ ava -jar target/hello-springboot-1.0.jar
If your project was named demo instead of hello-springboot , then substitute the properly named JAR file ( demo-1.0.jar ).
That’s it!
We’ll notice this sort of idiom when we explore MicroProfile in the next chapter, too.
Calling Another Service
In a microservices environment, each service is responsible for providing its functionality or service to other collaborators. As we discussed in the first chapter, building distributed systems is hard, and we cannot abstract away the network or the potential for failures. We will cover how to build resilient interactions with our dependencies in Chapter 5 . In this section, however, we will just focus on getting a service to talk to a dependent service.
If we wish to extend the hello-springboot microservice, we will need to create a service that we can call using Spring’s REST client functionality. For this example and the rest of the examples in the report, we’ll use a backend service and modify our service to reach out to the backend to generate the greetings we want to be able to use, as indicated by Figure 2-5 .

Figure 2-5. Calling another service
If you look at the
source code for this report
, you’ll see a Maven module called
backend
that contains a very simple
HTTP servlet that can be invoked with a GET request and query
parameters. The code for this backend is very simple, and it does not use
any of the microservice frameworks (Spring Boot, MicroProfile etc.). We have created a
ResponseDTO
object that encapsulates
time
,
ip
, and
greeting
fields. We also leverage the awesome Jackson
library for JSON data binding, as seen here:
@WebServlet(urlPatterns={"/api/backend"})publicclassBackendHttpServletextendsHttpServlet{@OverrideprotectedvoiddoGet(HttpServletRequestreq,HttpServletResponseresp)throwsServletException,IOException{resp.setContentType("application/json");ObjectMappermapper=newObjectMapper();Stringgreeting=req.getParameter("greeting");ResponseDTOresponse=newResponseDTO();response.setGreeting(greeting+" from cluster Backend");response.setTime(System.currentTimeMillis());response.setIp(getIp());PrintWriterout=resp.getWriter();mapper.writerWithDefaultPrettyPrinter().writeValue(out,response);}privateStringgetIp(){Stringhostname=null;try{hostname=InetAddress.getLocalHost().getHostAddress();}catch(UnknownHostExceptione){hostname="unknown";}returnhostname;}}
To start up the backend service on port
8080
, navigate to the
backend
directory and run the following command:
$ mvn wildfly:run
The
backend
project uses the Maven WildFly plug-in, which allows us to
quickly boot up our app using
mvn wildfly:run
.
This service is exposed at
/api/backend
and takes a query parameter called
greeting
. For example, when we call this service with the path
/api/backend?greeting=Hello
, like this (you can also visit this URL with your browser):
$ curl -X GET http://localhost:8080/api/backend?greeting=Hello
Then the backend service will respond with a JSON object something like this:
{"greeting":"Hello from cluster Backend","time":1459189860895,"ip":"172.20.10.3"}
Next, we’ll create a new HTTP endpoint, /api/greeting , in our hello-springboot microservice and use Spring to call this backend.
First, we create a class in
src/main/java/com/examples/hellospringboot
called
GreeterRestController
and fill it in similarly to how we filled in the
HelloRestController
class (see
Example 2-4
).
Example 2-4. src/main/java/com/example/hellospringboot/GreeterRestController.java
@RestController@RequestMapping("/api")@ConfigurationProperties(prefix="greeting")publicclassGreeterRestController{privateStringsaying;privateStringbackendServiceHost;privateintbackendServicePort;@RequestMapping(value="/greeting",method=RequestMethod.GET,produces="text/plain")publicStringgreeting(){StringbackendServiceUrl=String.format("http://%s:%d/api/backend?greeting={greeting}",backendServiceHost,backendServicePort);System.out.println("Sending to: "+backendServiceUrl);returnbackendServiceUrl;}}
We’ve left out the setters for the properties in this class, but
make sure you have them in your source code
! Note that we are using the
@ConfigurationProperties
annotation again to configure the REST controller here, although this time we are
using the
greeting
prefix. We also create a GET endpoint, like we did
with the
hello
service; and all it returns at the moment is a string
with the values of the backend service host and port concatenated
(these values are injected in via the
@ConfigurationProperties
annotation). Let’s add the
backendServiceHost
and
backendServicePort
to our
application.properties
file:
greeting.saying=Hello Spring Boot
greeting.backendServiceHost=localhost
greeting.backendServicePort=8080
Next, we’re going to use Spring’s
RestTemplate
to do the invocation of
the remote service. Following a long-lived Spring convention with its
template patterns, the
RestTemplate
wraps common HTTP/REST idioms inside a convenient wrapper abstraction which then handles all the
connections and marshalling/unmarshalling the results of an invocation.
RestTemplate
uses the native JDK for HTTP/network access, but you can
swap that out for Apache HttpComponents, OkHttp, Netty, or others.
Example 2-5
shows what the source looks like when using the
RestTemplate
(again,
the getters/setters are omitted here, but required). We are communicating with
the backend service by constructing a URL based on the host and port
that have been injected, and we add a GET query parameter called
greeting
. The value we send to the backend service for the
greeting
parameter is from the
saying
field of the
GreeterRestController
object, which gets injected as part of the configuration when we add
the
@ConfigurationProperties
annotation.
Example 2-5. src/main/java/com/example/GreeterRestController.java
@RestController@RequestMapping("/api")@ConfigurationProperties(prefix="greeting")publicclassGreeterRestController{privateRestTemplatetemplate=newRestTemplate();privateStringsaying;privateStringbackendServiceHost;privateintbackendServicePort;@RequestMapping(value="/greeting",method=RequestMethod.GET,produces="text/plain")publicStringgreeting(){StringbackendServiceUrl=String.format("http://%s:%d/api/backend?greeting={greeting}",backendServiceHost,backendServicePort);System.out.println("Sending to: "+backendServiceUrl);BackendDTOresponse=template.getForObject(backendServiceUrl,BackendDTO.class,saying);returnresponse.getGreeting()+" at host: "+response.getIp();}}
Next, we add the
BackendDTO
class, which is used to encapsulate
responses from the backend (
Example 2-6
).
Example 2-6. src/main/java/com/examples/hellospringboot/BackendDTO.java
publicclassBackendDTO{privateStringgreeting;privatelongtime;privateStringip;publicStringgetGreeting(){returngreeting;}publicvoidsetGreeting(Stringgreeting){this.greeting=greeting;}publiclonggetTime(){returntime;}publicvoidsetTime(longtime){this.time=time;}publicStringgetIp(){returnip;}publicvoidsetIp(Stringip){this.ip=ip;}}
Now let’s build the microservice and verify that we can call this new greeting endpoint and that it properly calls the backend. First, start the backend if it’s not already running. Navigate to the backend directory of the source code that comes with this application and run it:
$ mvn clean wildfly:run
Next, we’ll build and run the Spring Boot microservice. Let’s also
configure this service to run on a different port than the default port
(
8080
) so that it doesn’t collide with the backend service, which is
already running on port
8080
:
$ mvn clean spring-boot:run -Dserver.port=9090
Later in the report we’ll see how running these microservices in their own Linux container removes the restriction of port swizzling at runtime.
Now, point your browser to http://localhost:9090/api/greeting to see if the microservice properly calls the backend and displays what we’re expecting, as shown in Figure 2-6 .

Figure 2-6. Successful backend
Where to Look Next
In this chapter, you learned what Spring Boot is and how it’s different from traditional WAR/EAR deployments. You also saw some simple use cases, including exposing an HTTP/REST endpoint, externalizing configuration, exposing metrics, and calling another service. This is just scratching the surface; if you’re interested in learning more about Spring Boot, please take a look at the following references:
Chapter 3. Eclipse MicroProfile for Microservices
The next Java microservice framework we’ll look at is MicroProfile.
Java Enterprise Edition (EE) (now Jakarta EE) has been the workhorse of enterprise Java applications for more than 15 years. Many enterprises have heavily invested in open source and proprietary Java EE technologies, and this has affected everything from how they hire software talent to training, tooling, and management. Java EE has always been very capable at helping developers build tiered applications by offering functionality like servlets/JavaServer Pages (JSPs), transactions, component models, messaging, and persistence.
Despite its popularity, recently the feeling began to grow that Java EE’s pace of innovation was too slow for a world that demanded cloud-native applications, microservices, and containers. This feeling prompted various Java User Groups, Java Champions, vendors, and corporations to join forces and release the MicroProfile specification.
MicroProfile 1.0, announced during JavaOne 2016, was composed of the CDI, JSON-P, and JAX-RS specifications from Java EE. These base APIs allow experienced Java EE developers to utilize their existing skill sets for this fast-paced, innovative, and open source specification.
As a specification, there are several MicroProfile implementations: these include Thorntail from Red Hat, Payara Micro from Payara, TomEE from Apache, and OpenLiberty from IBM, just to name a few.
Because Java EE had a strong influence on MicroProfile, it is worth mentioning that in 2017, Oracle donated Java EE to the Eclipse Foundation under the Jakarta EE brand. Although Jakarta EE and MicroProfile share the same origin, their purpose remains very different. While Jakarta EE is a continuation of Java EE and focuses on enterprise applications, MicroProfile instead focuses on Enterprise microservices applications.
The MicroProfile 2.1 specification defines the base programming model using the Jakarta EE CDI, JSON-P, JAX-RS, and JSON-B APIs, and adds Open Tracing, Open API, Rest Client, Config, Fault Tolerance, Metrics, JWT Propagation, and Health Check APIs (see Figure 3-1 ). Development remains active, with groups working on Reactive Streams, Reactive Messaging, GraphQL, long running actions, and service mesh features.
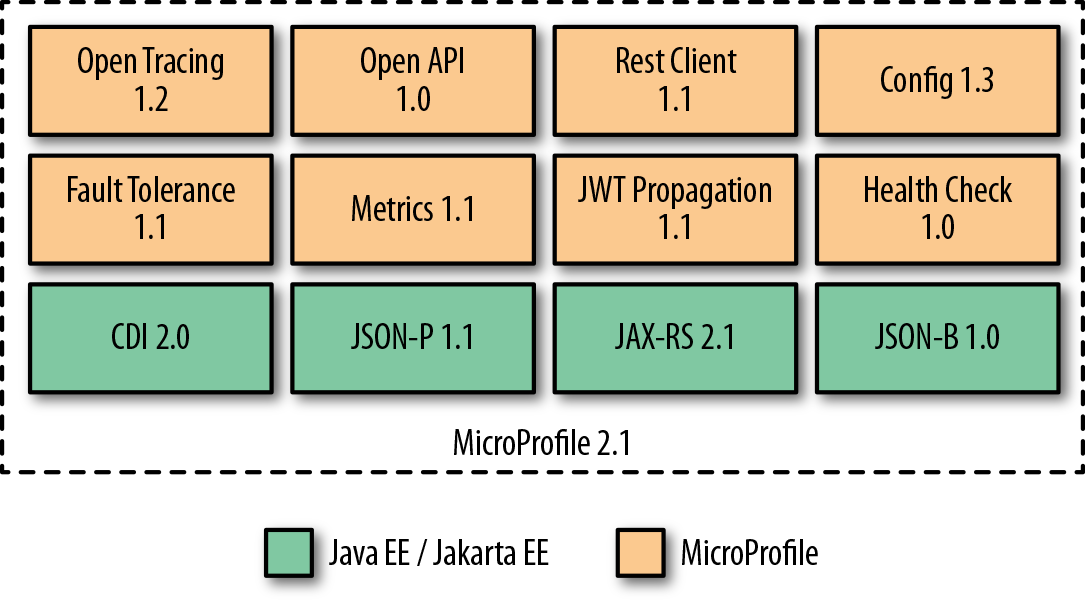
Figure 3-1. MicroProfile 2.1 APIs
Thorntail
Thorntail is the MicroProfile implementation from Red Hat. It is a complete teardown of the WildFly application server into bite-sized, reusable components that can be assembled and formed into a microservice application. Assembling these components is as simple as including a dependency in your Java Maven (or Gradle) build file; Thorntail takes care of the rest.
Thorntail evaluates your pom.xml (or Gradle) file and determines what dependencies your microservice actually uses (e.g., CDI, OpenTracing, and Metrics), and then builds an uber-JAR (just like Spring Boot and Dropwizard) that includes the minimal APIs and implementations necessary to run your service.
Besides the MicroProfile API, Thorntail provides many other functionalities. Some components provide only access to other APIs, such as JPA or JMS; other components provide higher-level capabilities, such as integration with Infinispan.
Getting Started
You can start a new Thorntail project by using the Thorntail Generator web console to bootstrap it (similar to Spring Initializr for Spring Boot). Simply open the page and fill in the fields with the following values, as shown in Figure 3-2 :
-
Group ID: com.redhat.examples
-
Artifact ID: hello-microprofile
-
Dependencies: MicroProfile Config, JAX-RS
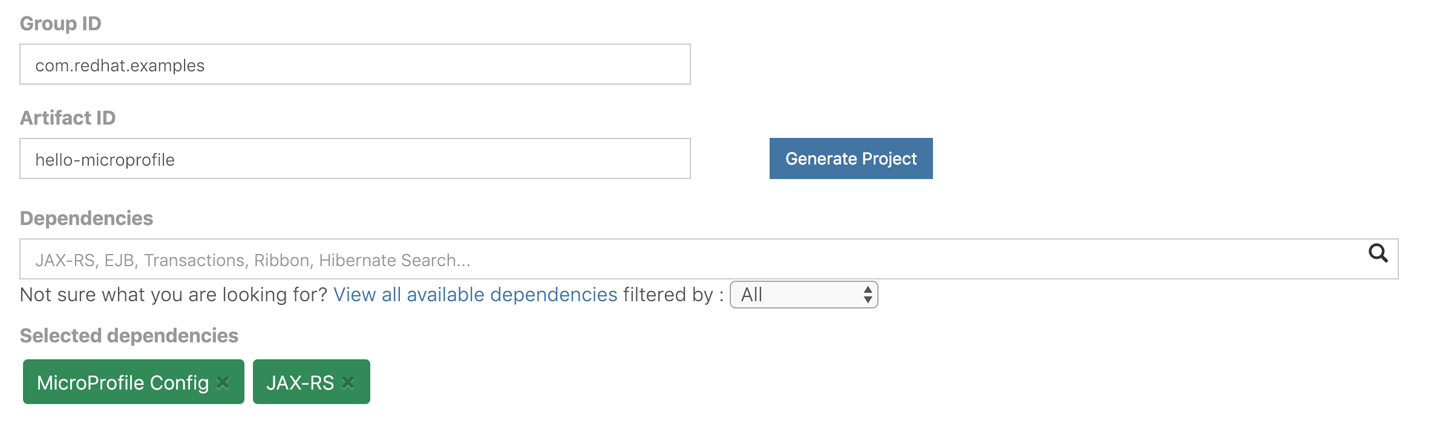
Figure 3-2. Thorntail Generator
Now click the blue Generate Project button. This will cause a file called hello-microprofile.zip to be downloaded. Save the file and extract it.
Navigate to the hello-microprofile directory, and try running the following command:
$ mvn thorntail:run
Make sure that you have stopped the
backend
service that you started in the previous chapter.
If everything boots up without any errors, you should see some logging similar to this:
2018-12-14 15:23:54,119 INFO  [org.jboss.as.server] (main)
    WFLYSRV0010: Deployed "demo.war" (runtime-name : "demo.war")
2018-12-14 15:23:54,129 INFO  [org.wildfly.swarm] (main)
    THORN99999: Thorntail is Ready
Congrats! You have just gotten your first MicroProfile application up and running. If you navigate to http://localhost:8080/hello in your browser, you should see the output shown in Figure 3-3 .
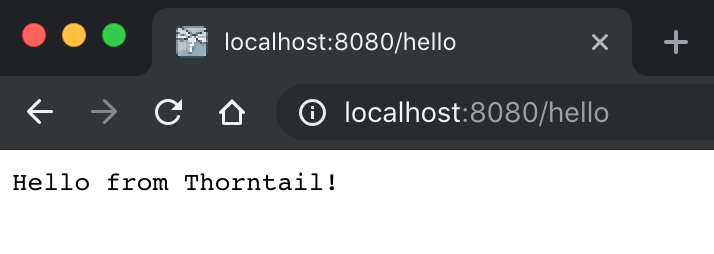
Figure 3-3. Hello from Thorntail
Hello World
Just like with the Spring Boot framework in the preceding chapter, we want to add some basic “Hello World” functionality and then incrementally add more functionality on top of it.
We want to expose an HTTP/REST endpoint at
/api/hello
that will return “Hello MicroProfile from
X
,” where
X
is the IP
address where the service is running. To do this, navigate to
src/main/java/com/examples/hellomicroprofile/rest
. This location should have been created for
you if you followed the preceding steps. Then create a new Java class called
HelloRestController
, as shown in
Example 3-1
. We’ll add a method named
hello()
that returns a string along with the IP address of where the service is running. You’ll see in
Chapter 6
, in the sections on load balancing and service discovery, how the host IPs can be used to demonstrate proper failover, load balancing, etc.
Example 3-1. src/main/java/com/examples/hellomicroprofile/rest/HelloRestController.java
publicclassHelloRestController{publicStringhello(){Stringhostname=null;try{hostname=InetAddress.getLocalHost().getHostAddress();}catch(UnknownHostExceptione){hostname="unknown";}return"Hello MicroProfile from "+hostname;}}
Add the HTTP Endpoints
You might have noticed that the POJO class
HelloRestController
in the MicroProfile project has exactly the same implementation as the
HelloRestController
class in the Spring Boot project. The only exception will be the HTTP endpoint annotations, which we add in
Example 3-2
:
-
@Path -
Maps specific parts of the HTTP URI path to classes and methods.
-
@GET -
Specifies that any HTTP GET method will invoke the annotated method. The method won’t be called if the path is the same but the HTTP method is anything other than GET.
-
@Produces -
Specifies the MIME type of the response.
Again, note that import statements are omitted in the following example.
Example 3-2. src/main/java/com/examples/hellospringboot/HelloRestController.java
@Path("/api")publicclassHelloRestController{@GET@Produces("text/plain")@Path("/hello")publicStringhello(){Stringhostname=null;try{hostname=InetAddress.getLocalHost().getHostAddress();}catch(UnknownHostExceptione){hostname="unknown";}return"Hello MicroProfile from "+hostname;}}
In this code, all we’ve done is add the aforementioned annotations. For
example,
@Path("/api")
at the class level says “map any
method-level HTTP endpoints under this root URI path.” When we add
@Path("/hello")
and
@GET
, we are telling MicroProfile to expose an HTTP GET endpoint at
/hello
(which will really be
/api/hello
). The annotation
@Produces("text/plain")
maps requests with a media type of
Accept: text/plain
to this method.
If you build the application and run
thorntail:run
again, you should
be able to reach the HTTP endpoint:
$ mvn clean thorntail:run
Now if you point your browser to http://localhost:8080/api/hello , you should see a response similar to the one shown in Figure 3-4 .

Figure 3-4. Successful hello
Now, the same way as we did for Spring Boot, we will see how to inject external properties into our app using MicroProfile’s Config API.
Externalize Configuration
Like Spring Boot, MicroProfile defines a mechanism to
externalize configuration. It uses different
ConfigSource
s to consume configuration from system properties, environment variables, or even from a
META-INF/microprofile-config.properties
file. Each of
these sources has a different priority, so configuration values can be overwritten.
To see how simple it is to consume external configuration, let’s add a new property to our src/main/resources/META-INF/microprofile-config.properties file (remember to create the folder structure and the file if they don’t exist):
helloapp.saying=Guten Tag aus
Now, as shown in
Example 3-3
, let’s add the
@Inject
and
@ConfigProperty("helloapp.saying")
annotations and our new
saying
field to the
HelloRestController
class. Note that, unlike with Spring Boot, we don’t need setters or getters.
Example 3-3. src/main/java/com/examples/hellomicroprofile/HelloRestController.java
@Path("/api")publicclassHelloRestController{@Inject@ConfigProperty(name="helloapp.saying")privateStringsaying;@GET@Produces("text/plain")@Path("/hello")publicStringhello(){Stringhostname=null;try{hostname=InetAddress.getLocalHost().getHostAddress();}catch(UnknownHostExceptione){hostname="unknown";}returnsaying+" "+hostname;}}
Because we’ve started using the CDI API in our examples, we’ll also need to add the beans.xml file, with the contents shown in Example 3-4 .
Example 3-4. src/main/resources/META-INF/beans.xml
<?xml version="1.0" encoding="UTF-8"?><beansxmlns="http://xmlns.jcp.org/xml/ns/javaee"xmlns:xsi="http://www.w3.org/2001/XMLSchema-instance"xsi:schemaLocation="http://xmlns.jcp.org/xml/ns/javaeehttp://xmlns.jcp.org/xml/ns/javaee/beans_1_1.xsd"bean-discovery-mode="all"></beans>
This file will instruct the CDI API to process all the injection points marked with the
@Inject
annotation.
Let’s stop our application from running (if we haven’t) and restart it:
$ mvn clean thorntail:run
Now if we navigate to http://localhost:8080/api/hello we should see the German version of the saying, as shown in Figure 3-5 .
Figure 3-5. Successful German hello
Expose Application Metrics and Information
Another similarity with Spring Boot is the ability of MicroProfile applications to expose endpoints that can be used to monitor our applications. To enable this, we need to add the MicroProfile Metrics dependency to our pom.xml file.
Open up the pom.xml file for the hello-microprofile microservice and add the following Maven dependency within the <dependencies>…</dependencies> section:
<dependency><groupId>io.thorntail</groupId><artifactId>microprofile-metrics</artifactId></dependency>
Adding this dependency will cause the application to expose a lot of information that will be very handy for debugging and general insight.
Now stop your microservice and restart it by running:
$ mvn clean thorntail:run
Try hitting the URL http://localhost:8080/metrics and examine what gets returned. You should see something like the result in Figure 3-6 .

Figure 3-6. MicroProfile metrics
Easy, right?
Running Outside of Maven
Remember how easy it was to run Spring Boot outside Maven? Luckily, with MicroProfile it just takes the exact same few steps to get a microservice ready for shipment and production.
Just like Spring Boot, MicroProfile prefers atomic, executable JARs with all dependencies packed into a flat classpath. This means the JAR that we create as part of a call to
mvn clean package
is
executable and contains all we need to run our microservice in a Java
environment! To test this out, go to the root of the
hello-microprofile
microservice project and run the following commands:
$ mvn clean package
$ java -jar target/demo-thorntail.jar
That’s it! Exactly the same approach used by Spring Boot.
Calling Another Service
In a microservices environment, each service is responsible for providing its functionality or service to other collaborators. If we wish to extend the hello_microprofile microservice, we will need to create a service that we can call using JAX-RS client functionality. Just like we did for the Spring Boot microservice, we’ll leverage the backend service from the source code that accompanies this report. The interaction will look similar to Figure 3-7 .

Figure 3-7. Calling another service
If you look at the
source code for this report
, you’ll see a Maven module called
backend
which contains a very simple
HTTP servlet that can be invoked with a GET request and query
parameters. The code for this backend is very simple, and it does not use
any of the microservice frameworks (Spring Boot, MicroProfile, etc.).
To start up the backend service on port
8080
, navigate to the
backend
directory and run the following:
$ mvn clean wildfly:run
Remember that the hello-microprofile service should be stopped before running the backend service.
This service is exposed at
/api/backend
and takes a query parameter called
greeting
. For example, when we call this service with the path
/api/backend?greeting=Hello
, like this (you can also visit this URL with your browser):
$ curl -X GET http://localhost:8080/api/backend?greeting=Hello
We get back a JSON object like this:
{"greeting":"Hello from cluster Backend","time":1459189860895,"ip":"172.20.10.3"}
Next, we’ll create a new HTTP endpoint, /api/greeting , in our hello-microprofile microservice and use the JAX-RS Client API to call this backend.
First, we create a new class in
src/main/java/com/examples/hellomicroprofile
called
GreeterRestController
and fill it in similarly to how we filled in the
HelloRestController
class (see
Example 3-5
).
Example 3-5. src/main/java/com/example/hellomicroprofile/rest/GreeterRestController.java
@Path("/api")publicclassGreeterRestController{@Inject@ConfigProperty(name="greeting.saying",defaultValue="Hello")privateStringsaying;@Inject@ConfigProperty(name="greeting.backendServiceHost",defaultValue="localhost")privateStringbackendServiceHost;@Inject@ConfigProperty(name="greeting.backendServicePort",defaultValue="8080")privateintbackendServicePort;@GET@Produces("text/plain")@Path("greeting")publicStringgreeting(){StringbackendServiceUrl=String.format("http://%s:%d",backendServiceHost,backendServicePort);return"Sending to: "+backendServiceUrl}}
We’ve created a simple JAX-RS resource here that exposes an
/api/greeting
endpoint that just returns the value of the
backendServiceUrl
field. Also note that we’re injecting the backend host and port as environment variables that have default values if no environment variables are set. Again, we’re using MicroProfile Config’s
@ConfigProperty
annotation to accomplish this.
Let’s also add the
BackendDTO
class, shown in
Example 3-6
, which is used to encapsulate responses from the backend.
Example 3-6. src/main/java/com/examples/hellomicroprofile/BackendDTO.java
publicclassBackendDTO{privateStringgreeting;privatelongtime;privateStringip;publicStringgetGreeting(){returngreeting;}publicvoidsetGreeting(Stringgreeting){this.greeting=greeting;}publiclonggetTime(){returntime;}publicvoidsetTime(longtime){this.time=time;}publicStringgetIp(){returnip;}publicvoidsetIp(Stringip){this.ip=ip;}}
Next, let’s add our JAX-RS client implementation to communicate with the backend service. It should look like Example 3-7 .
Example 3-7. src/main/java/com/example/hellospringboot/GreeterRestController.java
@Path("/api")publicclassGreeterRestController{@Inject@ConfigProperty(name="greeting.saying",defaultValue="Hello")privateStringsaying;@Inject@ConfigProperty(name="greeting.backendServiceHost",defaultValue="localhost")privateStringbackendServiceHost;@Inject@ConfigProperty(name="greeting.backendServicePort",defaultValue="8080")privateintbackendServicePort;@GET@Produces("text/plain")@Path("greeting")publicStringgreeting(){StringbackendServiceUrl=String.format("http://%s:%d",backendServiceHost,backendServicePort);System.out.println("Sending to: "+backendServiceUrl);Clientclient=ClientBuilder.newClient();BackendDTObackendDTO=client.target(backendServiceUrl).path("api").path("backend").queryParam("greeting",saying).request(MediaType.APPLICATION_JSON_TYPE).get(BackendDTO.class);returnbackendDTO.getGreeting()+" at host: "+backendDTO.getIp();}}
Now let’s build the microservice and verify that we can call this new
greeting endpoint and that it properly calls the backend. We’ll
configure this service to run on a different port than the default
(
8080
) so that it doesn’t collide with the backend service, which is
already running on that port:
$ mvn thorntail:run \
  -Dswarm.network.socket-binding-groups.standard-sockets
  .port-offset=100
In Chapter 6 , we’ll see how running these microservices in their own Linux containers removes the restriction of port swizzling at runtime. With all that done, you can point your browser to http://localhost:8180/api/greeting to see if our microservice properly calls the backend and displays what we’re expecting, as shown in Figure 3-8 .
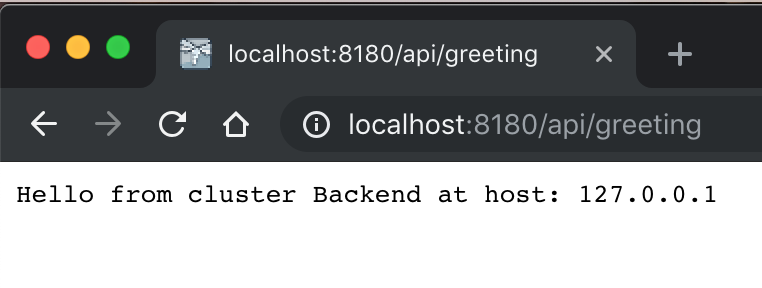
Figure 3-8. Successful backend
Where to Look Next
In this chapter, you learned about the MicroProfile specification and its Thorntail implementation. You also learned how to expose REST endpoints, configuration, and metrics and make calls to external services. This was meant as a quick introduction to Thorntail and is by no means a comprehensive guide. Check out the following links for more information:
Chapter 4. API Gateway with Apache Camel
Now that you know how to build microservices, you could continue building more and more. However, as the number of microservices grows, the complexity for the client who is consuming these APIs also grows.
Real applications could have dozens or even hundreds of microservices. A simple process like buying a book from an online store like Amazon can cause a client (your web browser or your mobile app) to use several other microservices. A client that has direct access to the microservice would have to locate and invoke them and handle any failures they caused itself. So, usually a better approach is to hide those services behind a new service layer. This aggregator service layer is known as an API gateway .
Another advantage of using an API gateway is that you can add cross-cutting concerns like authorization and data transformation in this layer. Services that use non-internet-friendly protocols can also benefit from the usage of an API gateway. However, keep in mind that it usually isn’t recommended to have a single API gateway for all the microservices in your application. If you (wrongly) decided to take that approach, it would act just like a monolithic bus, violating microservice independence by coupling all the microservices. Adding business logic to an API gateway is a mistake and should be avoided.
Apache Camel
Apache Camel is an open source integration framework that is well suited to implementing API gateways. The framework implements most of the patterns for enterprise application integration (EAI) described in the book Enterprise Integration Patterns , by Gregor Hohpe and Bobby Woolf (Addison-Wesley). Each enterprise integration pattern (EIP) describes a solution for a common design problem that occurs repeatedly in many integration projects. The book documents 65 EIPs, taking a technology-agnostic approach.
Apache Camel uses a consistent API based on EIPs to have a well-defined programming model for integration. With over 200 components, the developer can connect Apache Camel to almost any source/destination. In addition to HTTP, FTP, File, JPA, SMTP, and Websocket components, there are even components for platforms like Twitter, Facebook, AWS, etc.
Apache Camel is very powerful, yet very simple to use. This makes it an ideal choice for creating the API gateway for our microservices.
Apache Camel can be executed as a standalone application or be embedded in a existing application. For our API gateway example, we will use Camel in a Spring Boot application.
Getting Started
Camel applications can be created by declaring the Maven dependencies in an existing application, or by using an existing Maven Archetype.
Since we already showed how to use the Spring CLI to create the hello-springboot application, this time we will use the Maven Archetype approach.
The following command will create the Spring Boot application with Camel in a directory named api-gateway :
$ mvn archetype:generate -B \
   -DarchetypeGroupId=org.apache.camel.archetypes \
   -DarchetypeArtifactId=camel-archetype-spring-boot \
   -DgroupId=com.redhat.examples \
   -DartifactId=api-gateway \
   -Dversion=1.0
From the api-gateway directory, try running the following command:
$ mvn spring-boot:run
If everything boots up without any errors, you should see some logging similar to this:
2018-12-18  INFO 782 --- [main] MySpringBootApplication
    :Started MySpringBootApplication in 3.5 seconds
    (JVM running for 6.866)
Hello World
Hello World
Hello World
Hello World
Note that
Hello World
will be printed in the console every two seconds.
Building the API Gateway
Now that we have a Spring Boot application that can run Camel routes,
let’s change the functionality that prints
Hello World
every two seconds to call the
hello-springboot
and
hello-microprofile
microservices.
When we deploy our microservices in a Kubernetes cluster in the next chapter, the only microservice that will be exposed to the outside world will be this API gateway. The API gateway will call hello-springboot and hello-microprofile , which will call the backend. Figure 4-1 shows the overall architecture of our microservices and their interaction.

Figure 4-1. Calling another service
Before we start modifying our code, we need to declare the dependencies that we will use to connect to our microservices using the HttpClient v4 library, the servlet to register the REST endpoints, and the JSON library to marshal the result.
Open up the
pom.xml
file for the
api-gateway
microservice and add the following Maven
dependency in the
<dependencies>...</dependencies>
section:
<dependency><groupId>org.apache.camel</groupId><artifactId>camel-http4-starter</artifactId></dependency><dependency><groupId>org.apache.camel</groupId><artifactId>camel-servlet-starter</artifactId></dependency><dependency><groupId>org.apache.camel</groupId><artifactId>camel-jackson-starter</artifactId></dependency>
Next, we’ll modify the
MySpringBootRouter
class to connect to both microservices as shown in
Example 4-1
. We have already learned that the
@ConfigurationProperties(prefix="gateway")
annotation connects the
gateway
string property to this class. The
@Component
annotation makes Spring Boot find and register this class as a Spring Bean. Later, Camel will look for every Spring Bean that extends the class
RouteBuilder
to be used to configure the Camel routes using the method
configure()
.
Example 4-1. src/main/java/com/redhat/examples/MySpringBootRouter.java
@Component@ConfigurationProperties(prefix="gateway")publicclassMySpringBootRouterextendsRouteBuilder{privateStringspringbootsvcurl,microprofilesvcurl;privatestaticfinalStringREST_ENDPOINT="http4:%s/api/greeting?httpClient.connectTimeout=1000"+"&bridgeEndpoint=true+©Headers=true +&connectionClose=true";@Overridepublicvoidconfigure(){from("direct:microprofile").streamCaching().toF(REST_ENDPOINT,microprofilesvcurl).log("Response from MicroProfile microservice:${body}").convertBodyTo(String.class).end();from("direct:springboot").streamCaching().toF(REST_ENDPOINT,springbootsvcurl).log("Response from Spring Boot microservice: +${body}").convertBodyTo(String.class).end();rest().get("/gateway").enableCORS(true).route().multicast(AggregationStrategies.flexible().accumulateInCollection(ArrayList.class)).parallelProcessing().to("direct:microprofile").to("direct:springboot").end().marshal().json(JsonLibrary.Jackson).convertBodyTo(String.class).endRest();}publicvoidsetSpringbootsvcurl(Stringspringbootsvcurl){this.springbootsvcurl=springbootsvcurl;}publicvoidsetMicroprofilesvcurl(Stringmicroprofilesvcurl){this.microprofilesvcurl=microprofilesvcurl;}}
The
from("direct:...")
method in the
MySpringBootRouter
class declares a connector to the
hello-microprofile
and
hello-springboot
microservices. The URI used by this Camel connector is specified by the string declared in the
REST_ENDPOINT
final variable. The format
http4:_hostname_[:_port_][/_resourceUri_][_?options_]
is documented in the reference page for the
HTTP4 Camel component
.
After we have declared the destination routes
direct:microprofile
and
direct:springboot
, we declare our REST entry point using the method
rest()
. The method is followed by the verb
get("/gateway")
, which specifies what HTTP method and path this endpoint expects. This rest method also enables cross-origin resource sharing (CORS), which allows this endpoint to receive requests from a server on a different origin (domain).
Next, the REST request is routed via multicast to both routes using parallel processing, and the results are accumulated in an
ArrayList
collection. This is specified in the
route()
,
multicast()
, and
parallelProcessing()
methods. Finally, the result is marshaled into JSON format using the Jackson library in the
.marshal().json
(JsonLibrary.Jackson)
method.
The Camel Fluent API is very flexible yet makes the code very expressive. With less than 20 lines of code, we just built a REST endpoint that connects to other microservices in parallel, collects the results, and transforms them to JSON.
Configuring the API Gateway
The API gateway needs to connect to
hello-microprofile
and
hello-springboot
. The addresses of these microservices must not be hardcoded and should be configured externally. For that reason, we used the variables
springbootsvcurl
and
microprofilesvcurl
to provide those “service URLs.”
Another configuration that we need provide to our application is the context path that Camel will use for the REST endpoints. By default, Camel will bind the REST endpoints to
/camel/*
, but we want to use
/api/*
instead. For that reason, we will also configure the property
camel.component.servlet.mapping.context-path
in the
src/main/resources/application.properties
file.
Let’s add all these properties to that file now:
gateway.springbootsvcurl=localhost:8180
gateway.microprofilesvcurl=localhost:8280

# to reconfigure the camel servlet context-path mapping
# to use /api/* instead of /camel/*
camel.component.servlet.mapping.context-path=/api/*
Calling All Microservices
Now that our API gateway is ready, we will start all four microservices locally using different ports:
-
backend :
8080 -
hello-springboot :
8180 -
hello-microprofile :
8280 -
api-gateway :
8380
To start up the
backend
service on port
8080
, navigate to the
backend
directory and run the following:
$ mvn clean wildfly:run
To start up the
hello-springboot
service on port
8180
, navigate to the
hello-springboot
directory and run the following:
$ mvn clean spring-boot:run -Dserver.port=8180
To start up the
hello-microprofile
service on port
8280
, navigate to the
hello-microprofile
directory and run the following:
$ mvn thorntail:run \
  -Dswarm.network.socket-binding-groups.standard-sockets
  .port-offset=200
Finally, start the
api-gateway
service on port
8380
. Navigate to the
api-gateway
directory and run the following:
$ mvn spring-boot:run -Dserver.port=8380
Now, point your browser to http: //localhost:8380/api/gateway to verify that the API gateway calls the two microservices and aggregates both responses in a JSON array, as shown in Figure 4-2 .

Figure 4-2. Successful API gateway
Where to Look Next
In this chapter, you learned about Apache Camel and the API gateway pattern. You also learned how to expose REST endpoints, configure Apache Camel routes, and make calls to external services. This was meant as a quick introduction to Apache Camel and is by no means a comprehensive guide. Check out the following links for more information:
Chapter 5. Deploying Microservices at Scale with Docker and Kubernetes
In the previous chapters we first talked about microservices at a high level, covering organizational agility, designing with dependency thinking, domain-driven design, and promise theory, then we took a deep dive into the weeds with three popular Java frameworks for developing microservices: Spring Boot, MicroProfile/Thorntail, and Apache Camel. We saw how we can leverage the powerful out-of-the-box capabilities these frameworks provide easily by exposing and consuming REST endpoints, utilizing environment configuration options, packaging as all-in-one executable JAR files, and exposing metrics. These concepts all revolve around a single instance of a microservice. But what happens when you need to manage dependencies, get consistent startup and shutdown behavior, do health checks, and load balance your microservices at scale? In this chapter, we’re going to discuss those high-level concepts so you understand more about the challenges of deploying microservices, regardless of language, at scale.
When we start to break out applications and services into microservices, we end up with more moving pieces by definition: we have more services, more binaries, more configuration, more interaction points, etc. We’ve traditionally dealt with deploying Java applications by building binary artifacts (JARs, WARs, and EARs), staging them somewhere (shared disks, JIRAs, and artifact repositories), opening a ticket, and hoping the operations team deploys them into an application server as we intended, with the correct permissions and environment variables and configurations. We also deploy our application servers in clusters with redundant hardware, load balancers, and shared disks and try to keep things from failing as much as possible. We may have built some automation around the infrastructure that supports this with great tools like Chef or Ansible, but somehow deploying applications still tends to be fraught with mistakes, configuration drift, and unexpected behaviors.
With this model, we do a lot of hoping, which tends to break down quickly in current environments (never mind at scale). Is the application server configured in dev/QA/prod like it is on our machine? If it’s not, have we completely captured the changes that need to be made and expressed to the operations folks? Do any of our changes impact other applications also running in the same application server(s)? Are the runtime components like the operating system, Java virtual machine (JVM), and associated dependencies exactly the same as on our development machine? The JVM that runs an application is an implementation detail that’s highly coupled to how we configure and tune the application, so variations across environments can wreak havoc. When you start to deliver microservices, do you run them in separate processes on traditional servers? Is process isolation enough? What happens if one JVM goes berserk and takes over 100% of the CPU? Or the network I/O? Or a shared disk? What if all of the services running on that host crash? Are your applications designed to accommodate that? As we split our applications into smaller pieces, these issues become magnified.
Immutable Delivery
Immutable delivery concepts help us reason about these problems. With immutable delivery, we try to reduce the number of moving pieces into prebaked images as part of the build process. For example, imagine in your build process you could output a fully baked image consisting of the operating system, the intended version of the JVM, any sidecar applications, and all the configuration. You could then deploy this in one environment, test it, and migrate it along a delivery pipeline toward production without worrying about whether the environment or application is configured consistently. If you needed to make a change to your application, you could simply rerun this pipeline to produce a new immutable image of the application and then do a rolling upgrade to deliver it. If it didn’t work, you could roll the change back by deploying the previous image. No more worrying about configuration or environment drift or whether things were properly restored on a rollback.
This sounds great, but how do we do it? Executable JARs get us part of the way there, but fall short. The JVM is an implementation detail of our microservice, so how do we bundle the JVM? JVMs are written in native code and have native OS-level dependencies that we’ll need to package, along with configuration, environment variables, permissions, file directories, and other things. All of these details cannot be captured within a single executable JAR. Other binary formats, like virtual machine images, can properly encapsulate these details. However, for each microservice that may have different packaging requirements (JVM? Node.js? Golang? properties files? private keys?), we could easily see an explosion of VM images and combinations of language runtimes. If you automate this with infrastructure as code and have access to infrastructure as a service with properly exposed APIs, you can certainly accomplish this. In fact, building up VMs as part of an automated delivery pipeline is exactly what Netflix did to achieve this level of immutable delivery. But it can be hard to manage, patch, and change multiple VMs, each of which virtualizes an entire machine with required device drivers, operating systems, and management tooling.
What other lightweight packaging and image formats can we explore?
Docker and Linux Containers
Docker
came along a few years ago with an elegant solution to immutable
delivery. Docker allows us to package our applications with all of the
dependencies they need (OS, JVM, other application dependencies, etc.) in
a lightweight, layered image format. It uses these
images to run instances that run our applications inside
Linux containers with isolated CPU, memory, network, and disk usage.
In a way, these containers are a form of
application virtualization
or
process virtualization
. They allow a process to execute while thinking it’s
the only thing running (e.g., list processes with
ps
and you see only
your application’s process there) and that it has full access to the CPUs, memory, disk, network, and other resources, when in reality, it doesn’t. Each application can only use the resources it’s allocated. For example, I can start a Docker container with a slice of CPU, a segment of memory, and limits on how much network I/O it can perform. From outside the Linux container, on the host, the application just looks like another process. No virtualization of device drivers, operating systems, or network stacks, no special hypervisors—it’s just a process. This fact also means we can get even more applications running on a single set of hardware for higher density without the overhead of additional operating systems and other pieces of a VM that would be required to achieve similar isolation qualities.
What’s happening under the covers is nothing revolutionary either.
Features called
cgroups
,
namespaces
, and
chroot
, which have been built into the Linux kernel for some time, are used to create the appearance of this application virtualization. Linux containers have been around for over 10 years, and process virtualization existed in
Solaris and FreeBSD even before that. Traditionally, using these
underlying Linux primitives, or even higher-level abstractions like
lxc
, was complicated at best. Then Docker came along and simplified
the API and user experience around Linux containers. Its client CLI that can easily spin up these containers
based on the Docker image format, which has now been opened up to the
larger community in the Open Container Initiative (OCI). This ease of
use and image format are changing the way we package and deliver
software.
Once we have an image, spinning up many Linux containers becomes trivial. The layers are built as deltas between a base image (e.g., RHEL, Debian, or some other Linux operating system) and the application files. Distributing new applications just distributes the new layers on top of existing base layers. This makes distributing images much easier than shuttling around bloated cloud machine images. Also, if a vulnerability (Shellshock, Heartbleed, etc.) is found in the base image, that image can be rebuilt without having to try to patch each and every VM. This makes it easy to run a container anywhere: containers can be moved from a developer’s desktop to dev, QA, or production in a portable way without having to manually ensure or hope that all of the correct dependencies are in the right place (does this application use JVM 1.6, 1.7, or 1.8?). If we need to redeploy with a change (new app) or fix a base image, doing so just changes the layers in the image that require changes.
When we have standard APIs and open formats, we can build tooling that doesn’t have to know or care what’s running in the container. How do we start an application? How do we stop it? How do we do health checking? How do we aggregate logs, metrics, and insight? We can build or leverage tooling that does all of these things in a technology-agnostic way. Service discovery, load balancing, fault tolerance, configuration, and more can also be pushed to lower layers in the application stack so that application developers don’t have to try to cobble all this together by hand and complicate their application code.
Kubernetes
Google is known for running Linux containers at scale. In 2014, Google engineer Joe Beda said the company started more than two billion containers per week. In fact, “everything” running at Google runs in Linux containers, and it’s all managed by their Borg cluster management platform . Google even had a hand in creating the underlying Linux technology that makes containers possible: in 2006 its engineers started working on “process containers,” which eventually became cgroups and was merged into the Linux kernel code base and released in 2008. With its breadth and background of operating containers at scale, it’s no surprise Google has had a strong influence on platforms built around containers. Here are just a few examples:
-
The original Cloud Foundry creators (Derek Collison and Vadim Spivak) worked at Google and spent several years using Google’s Borg cluster management solution.
-
Apache Mesos was created for a PhD thesis, and its creator (Ben Hindman) interned at Google and had many conversations with Google engineers around container clustering, scheduling, and management.
-
The Kubernetes container cluster management platform was originally created by the same engineers who built Borg at Google; it was open sourced back in 2013 when Docker rocked the technology industry.
Today, the Kubernetes community is large, open, and rapidly growing with contributors from Google, Red Hat, CoreOS, and many other organizations (and lots of independent individuals!). Kubernetes brings a lot of functionality for running clusters of microservices inside Linux containers at scale. Google has packaged over a decade of experience into Kubernetes, and being able to leverage this knowledge and functionality for our own microservices deployments is game-changing. The web-scale companies have been doing this for years, and a lot of them (Netflix, Amazon, etc.) had to hand-build much of the functionality that Kubernetes now has baked in.
Kubernetes has a handful of simple primitives that you should understand before we dig into examples. In this chapter we’ll introduce you to these concepts, and in the following chapter we’ll make use of them for managing a cluster of microservices.
Pods
A pod is a grouping of one or more Docker containers (like a pod of whales?). A typical deployment of a pod, however, will often be one-to-one with a Docker container. If you have sidecar, ambassador, or adapter deployments that must always be colocated with the application, a pod is the way to group them . This abstraction is also a way to guarantee container affinity (i.e., Docker container A will always be deployed alongside Docker container B on the same host).
Kubernetes orchestrates, schedules, and manages pods. When we refer to an application running inside of Kubernetes, it’s running within a Docker container inside of a pod. A pod is given its own IP address, and all containers within the pod share this address (which is different from plain Docker, where each container gets an IP address). When volumes are mounted to the pod, they are also shared between the individual Docker containers running in the pod.
One last thing to know about pods: they are fungible. This means they can disappear at any time (either because the service crashed or because the cluster killed it). They are not like VMs, which you care for and nurture. Pods can be destroyed at any point. This falls within our expectation in a microservice world that things will (and do) fail, so we are strongly encouraged to write our microservices with this premise in mind. This is an important distinction to keep in mind as we talk about some of the other concepts in the following sections.
Labels
Labels
are simple key/value pairs that we can assign to pods, like
release=stable
or
tier=backend
. Pods (and other resources, but we’ll
focus on pods) can have multiple labels that group and categorize them in a
loosely coupled fashion, making it easier to build powerful clusters at scale. After
we’ve labeled our pods, we can use
label selectors
to find which pods
belong in which group. For example, if we had some pods labeled
tier=backend
and others labeled
tier=frontend
, using a label
selector expression of
tier != frontend
we could select all of the pods
that are not labeled “frontend.” Label selectors are used under the
covers for the next two concepts: replication controllers and services.
ReplicationControllers and Deployments
When talking about running microservices at scale, we will probably be
talking about multiple instances of any given microservice. Kubernetes
has a concept called the
ReplicationController
that manages the number of
replicas for a given set of microservices. For example, let’s say we
wanted to manage the number of pods labeled with
tier=backend
and
release=stable
. We could define a
ReplicationController
with the
appropriate label selector, and we would then be able to control the number of
those pods in the cluster by adjusting the value of the
replicas
field in the definition. If we set the replica count equal to 10, then
Kubernetes will reconcile its current state to reflect 10 pods running
for a given
ReplicationController
. If there are only five running at the moment, Kubernetes will spin up five more. If there are 20 running,
Kubernetes will kill 10 (which 10 it kills is nondeterministic, as far
as your app is concerned). Kubernetes will do whatever it needs to
converge with the desired state of 10 replicas. You can imagine
controlling the size of a cluster very easily with a
ReplicationController
.
Later, the Kubernetes project introduced another concept called a
Deployment
that watches the configuration of the replicas (like environment variables, CPU and memory limits, labels, arguments, etc.). If you update any of these configurations, Kubernetes will perform a
rolling update
to replace the previously declared number of replicas with new ones with the new configuration provided.
We will see examples of
Deployment
s in action in the next chapter.
Services
The last Kubernetes concept you should understand is the Kubernetes
Service
. We’ve seen that
ReplicationController
s can control the number of replicas of a
service we have. We also saw that pods die (either crash on
their own or be killed, maybe as part of a
ReplicationController
scale-down event). Therefore, when we try to communicate with a group of
pods, we should not rely directly on their IP addresses (each pod will
have its own IP address), as pods can come and go. What we need is a way
to group pods to discover where they are and how to communicate with them,
and possibly load balance against them. That’s exactly what the
Kubernetes
Service
does. It allows us to use a label selector to group
our pods and abstract them with a single virtual (cluster) IP that we
can then use to discover them and interact with them. We’ll show
some concrete examples in the next chapter.
With these simple concepts—pods, labels,
ReplicationController
s, and
Service
s, we can manage and scale our microservices the way Google has learned to (or learned not to). It takes many years and many failures to identify simple solutions to complex problems, so we highly encourage you to familiarize yourself with these concepts and experience the power of managing containers with Kubernetes for your microservices.
Getting Started with Kubernetes
Docker and Kubernetes are both Linux-native technologies; therefore, they must run in a Linux host operating system. If you’re working on a Windows or Mac developer machine, in order to take advantage of the great features Docker and Kubernetes bring you’ll need to use a guest Linux VM on your host operating system. You could download Docker Machine and Toolbox for your environment, but then you’d need to manually install Kubernetes (which can be a little tricky). You could use the upstream Kubernetes Vagrant images, but like with any fast-moving, open source project, those can change swiftly and be unstable at times. Additionally, to take full advantage of Docker’s portability, it’s best to use at least the same kernel of Linux between environments, and optimally the same Linux distribution and version. What other options do we have?
Minishift
To get started developing microservices with Docker and Kubernetes, we’re going to leverage a free developer tool called Minishift . Minishift is a small tool that runs on a developer’s machine, that contains Docker, Kubernetes, and a web console (actually, it runs Red Hat OpenShift, which is basically a version of Kubernetes with some other developer self-service and application lifecycle management features, but for this book we’ll just be using the Kubernetes APIs).
OpenShift
Red Hat OpenShift 3.x is an Apache v2 licensed open source developer self-service platform, OpenShift Origin , that has been revamped to use Docker and Kubernetes. OpenShift at one point had its own cluster management and orchestration engine, but with the knowledge, simplicity, and power that Kubernetes brings to the world of container cluster management, it would have been silly to try to compete. The broader community is converging around Kubernetes, and Red Hat is all in with Kubernetes.
OpenShift has many features, but one of the most important is that it’s
still native Kubernetes under the covers and supports role-based access
control, out-of-the-box software defined networking, security, logins,
developer builds, and many other things. We mention it here because the
flavor of Kubernetes that we’ll use for the rest of this book is based
on OpenShift. We’ll also use the
oc
OpenShift command-line tools, which give us a better user experience and allow us to easily log in to our Kubernetes clusters and control which project we’re deploying into. Minishift has both vanilla Kubernetes and OpenShift. For the rest of this book, we’ll be referring to OpenShift and Kubernetes interchangeably but using OpenShift.
Getting Started with Minishift
With Minishift, you can build, deploy, and run your microservices as Docker containers right on your laptop and then opt to deliver them in a pipeline through other application lifecycle management features inside of OpenShift or with your own tooling.
To continue with the examples and idioms in the rest of this report, please install Minishift now, following the instructions . There are multiple flavors of virtualization (e.g., xhyve, Hyper-V, Linux KVM/libvirtd, and VirtualBox) that you can use with Minishift. The installation instructions contain all of the details you need to get up and running.
To start Minishift, type the following:
$ minishift start
This should take you through the provisioning process and boot the VM.
The VM will expose a Docker daemon, the
Kubernetes API, and the
oc
command-line tools. The
oc
command-line tools will
allow you to log in to OpenShift/Kubernetes and manage your
projects/namespaces. You could use the
kubectl
commands yourself, but
logging in is easier with the
oc login
command, so for these examples,
we’ll use
oc
. To have
oc
available in your path, type:
$ eval $(minishift oc-env)
You might also need to configure OpenShift to enable some Docker images to be executed by any user. This is done by running the following command:
$ minishift addon apply anyuid
-- Applying addon 'anyuid':.
When Minishift starts, you will be logged in as a user called developer . To log in as admin , type:
$ minishift addon apply admin-user
-- Applying addon 'admin-user':..

$ oc login -u admin -p admin
Logged into "https://192.168.64.30:8443" as "admin"
using existing credentials.

You don't have any projects. You can try to create
a new project, by running

    oc new-project 	<projectname>
Next, let’s create a new project/namespace into which we’ll deploy our microservices:
$ oc new-project tutorial
Now using project "tutorial" on server
"https://192.168.64.30:8443".
Although not required to run these examples, installing the Docker CLI for your native developer laptop, is useful as well. This will allow you to list Docker images and Docker containers right from your developer laptop as opposed to having to log in to the Minishift VM. Once you have the Docker CLI installed, you should be able to run Docker directly from your command-line shell:
$ eval $(minishift docker-env)
$ docker ps
$ docker images
Where to Look Next
In this chapter, you learned a little about the pains of deploying and managing microservices at scale and how Linux containers can help. We can leverage immutable delivery to reduce configuration drift, enable repeatable deployments, and help us scale our applications regardless of whether they’re running. We can use Linux containers to enable service isolation, rapid delivery, and portability. We can leverage a scalable container management system like Kubernetes and take advantage of a lot of its built-in distributed system features, such as service discovery, failover, health checking, and more. We don’t need complicated port swizzling or complex service discovery systems when deploying on Kubernetes because these are problems that have been solved within the infrastructure itself. To learn more, please review the following resources:
Chapter 6. Hands-on Cluster Management, Failover, and Load Balancing
In Chapter 5 , we had a quick introduction to Linux containers, and cluster management. Let’s jump into using these things to solve issues with running microservices at scale. For reference, we’ll be using the microservice projects we developed in Chapters 2 , 3 , and 4 (Spring Boot, MicroProfile, and Apache Camel, respectively). The following steps can be accomplished with any of those three Java frameworks.
Getting Started
To deploy our microservices, we will assume that a Docker image exists. Each microservice described here already has a Docker image available at the Docker Hub registry, ready to be consumed. However, if you want to craft your own Docker image, this chapter will cover the steps to make it available inside your Kubernetes/OpenShift cluster.
Each microservice uses the same base Docker image provided by the Fabric8 team. The image fabric8/java-alpine-openjdk8-jdk uses
OpenJDK 8.0
installed on
Alpine Linux
distribution, which makes the image as small as 74 MB.
This image also provides nice features like adjusting the JVM arguments
-Xmx
and
-Xms
, and makes it really simple to run fat JARs.
An example Dockerfile to build a Java fat jar image would be as simple as:
FROMfabric8/java-alpine-openjdk8-jdkENVJAVA_APP_JAR <your-fat-jar-name>ENVAB_OFF trueADDtarget/<your-fat-jar-name> /deployments/
The environment variable
JAVA_APP_JAR
specifies the name of the JAR file that should be called by the
java -jar
command. The environment variable
AB_OFF
disables the agent bond that enables jolokia and JMX exporter.
Packaging Our Microservices as Docker Images
Navigate to the hello-springboot directory, and create a Dockerfile there with the following contents:
FROMfabric8/java-alpine-openjdk8-jdkENVJAVA_APP_JAR hello-springboot-1.0.jarENVAB_OFF trueADDtarget/hello-springboot-1.0.jar /deployments/
You can then run the following command to build the Docker image:
$ docker build -t rhdevelopers/hello-springboot:1.0 .
Sending build context to Docker daemon  111.3MB
Step 1/4 : FROM fabric8/java-alpine-openjdk8-jdk
 ---> 4353c2196b11
Step 2/4 : ENV JAVA_APP_JAR demo-thorntail.jar
 ---> Running in 777ae0de6868
 ---> 220aece2f437
Removing intermediate container 777ae0de6868
Step 3/4 : ENV AB_OFF true
 ---> Running in 02b3780c59a3
 ---> fc1bc50fc932
Removing intermediate container 02b3780c59a3
Step 4/4 : ADD target/demo-thorntail.jar /deployments/
 ---> 3a4e91b41727
Removing intermediate container b291546e0725
Successfully built 3a4e91b41727
The switch
-t
specifies the tag name, in the following format:
<organization-name>/<image-name>:<version>
.
If you want to try your newly built image, you can create a container using the command:
$ docker run -it --rm  \
-p 8080:8080 rhdevelopers/hello-springboot:1.0
The
-it
switch instructs Docker to create an interactive process and assign a terminal to it. The
--rm
switch instructs docker to delete this container when we stop it. The
-p 8080:8080
instructs Docker to assign port
8080
from the container to port
8080
in the Docker daemon host.
Once your container starts, you can open a new terminal and access it using the
curl
command:
$ curl $(minishift ip):8080/api/hello
Guten Tag aus 172.17.0.6
These are the basics steps to deploy your application in a Docker container and try it. However, we will not focus on pure Docker containers. Instead, in the next chapter, we will see how to use Kubernetes to run these microservices at scale. Before moving on, don’t forget to stop the running hello-springboot Docker container by pressing Ctrl-C.
Deploying to Kubernetes
There are several ways that we could deploy our microservices/containers inside a Kubernetes/OpenShift cluster. However, for didatic purposes, we will use YAML files that express very well what behavior we expect from the cluster.
In the
source code for this report
, for each microservice example there is a folder called
kubernetes
containing two files:
deployment.yml
and
service.yml
. The deployment file will create a
Deployment
object with one replica.
The
Deployment
also provides at least two environment variables. The one called
JAVA_OPTIONS
specifies the JVM arguments, like
-Xms
and
-Xmx
. The one called
GREETING_BACKENDSERVICEHOST
replaces the values we defined in our first two microservices to find the BACKEND service, as you’ll see in
“Service discovery”
.
Here is the deployment.yml file used for the hello-springboot microservice.
apiVersion:extensions/v1beta1kind:Deploymentmetadata:name:hello-springbootlabels:app:hello-springbootbook:microservices4javadevversion:v1spec:replicas:1selector:matchLabels:app:hello-springbootversion:v1template:metadata:labels:app:hello-springbootbook:microservices4javadevversion:v1spec:containers:-env:-name:JAVA_OPTIONSvalue:-Xmx256m -Djava.net.preferIPv4Stack=true-name:GREETING_BACKENDSERVICEHOSTvalue:backendimage:rhdevelopers/hello-springboot:1.0imagePullPolicy:IfNotPresentlivenessProbe:httpGet:# make an HTTP requestport:8080# port to usepath:/actuator/health# endpoint to hitscheme:HTTP# or HTTPSinitialDelaySeconds:20periodSeconds:5timeoutSeconds:1name:hello-springbootports:-containerPort:8080name:httpprotocol:TCPreadinessProbe:httpGet:# make an HTTP requestport:8080# port to usepath:/actuator/health# endpoint to hitscheme:HTTP# or HTTPSinitialDelaySeconds:10periodSeconds:5timeoutSeconds:1
Since the deployment.yml and service.yml files are stored together with the source code for this report, you can deploy the microservices by pointing directly to those files using the following commands. First, deploy the backend microservice:
$ oc create -f http://raw.githubuserconoc create -f http://
  raw.githubusercontent.com/redhat-developer/
  microservices-book/master/backend/kubernetes/deployment.yml

$ oc create -f http://raw.githubuserconoc create -f http://
  raw.githubusercontent.com/redhat-developer/
  microservices-book/master/backend/kubernetes/service.yml
Then deploy the hello-springboot microservice:
$ oc create -f http://raw.githubusercontent.com/
  redhat-developer/microservices-book/master/
  hello-springboot/kubernetes/deployment.yml

$ oc create -f http://raw.githubusercontent.com/
  redhat-developer/microservices-book/
  master/hello-springboot/kubernetes/service.yml
and the hello-microprofile microservice:
$ oc create -f http://raw.githubusercontent.com/
  redhat-developer/microservices-book/
  master/hello-microprofile/kubernetes/deployment.yml

$ oc create -f http://raw.githubusercontent.com/
  redhat-developer/microservices-book/
  master/hello-microprofile/kubernetes/service.yml
Finally, deploy the api-gateway microservice:
$ oc create -f http://raw.githubusercontent.com/
  redhat-developer/
  microservices-book/master/api-gateway/kubernetes/deployment.yml

$ oc create -f http://raw.githubusercontent.com/
  redhat-developer/
  microservices-book/master/api-gateway/kubernetes/service.yml
The deployment files will create four pods (one replica for each microservice). The service files will make each of these replicas visible to each other. You can check the pods that have been created through the command:
$ oc get pods
NAME                                 READY     STATUS
api-gateway-5985d46fd5-4nsfs         1/1       Running
backend-659d8c4cb9-5hv2r             1/1       Running
hello-microprofile-844c6c758-mmx4h   1/1       Running
hello-springboot-5bf5c4c7fd-k5mf4    1/1       Running
What advantages does Kubernetes bring as a cluster manager? Let’s start by exploring the first of many. Let’s kill a pod and see what happens:
$ oc delete pod hello-springboot-5bf5c4c7fd-k5mf4
pod "hello-springboot-5bf5c4c7fd-k5mf4" deleted
Now let’s list our pods again:
$ oc get pods
NAME                                 READY     STATUS
api-gateway-5985d46fd5-4nsfs         1/1       Running
backend-659d8c4cb9-5hv2r             1/1       Running
hello-microprofile-844c6c758-mmx4h   1/1       Running
hello-springboot-5bf5c4c7fd-28mpk    1/1       Running
Wow! There are still four pods! Another pod was created after we deleted the previous one. Kubernetes can start/stop/auto-restart your microservices for you. Can you imagine what a headache it would be to manually determine whether your services are started/stopped at any kind of scale? Let’s continue exploring some of the other valuable cluster management features Kubernetes brings to the table for managing microservices.
External access
Now that all our microservices have been deployed inside the cluster, we need to provide external access. Since we have an API Gateway defined, only this microservice needs to be exposed; it will be the single point of access to invoke the hello-microprofile and hello-springboot microservices. For a refresher on our microservices architetcure, take a look at Figure 6-1 .
Figure 6-1. Calling another service
To enable external access using OpenShift, we need to run the
oc expose service
command, followed by the name of the service that we want to expose (in this case,
api-gateway
):
$ oc expose service api-gateway
route.route.openshift.io/api-gateway exposed
Now you can try the
curl
command to test all microservices.
$ curl http://api-gateway-tutorial.$(minishift ip).nip.io
  /api/gateway
["Hello from cluster Backend at host: 172.17.0.7",
  "Hello Spring Boot from cluster Backend at host: 172.17.0.7"]
The output should show that you reached both microservices through the API gateway and both of them accessed the backend microservice, which means that everything is working as expected.
Scaling
One of the advantages of deploying in a microservices architecture is
independent scalability. We should be able to replicate the number of
services in our cluster easily without having to worry about port
conflicts, JVM or dependency mismatches, or what else is
running on the same machine. With Kubernetes, these types of scaling
concerns can be accomplished with the
Deployment
/
ReplicationController
. Let’s see
what deployments exist in our deployment:
 $ oc get deployments
NAME                 DESIRED   CURRENT   UP-TO-DATE   AVAILABLE
api-gateway          1         1         1            1
backend              1         1         1            1
hello-microprofile   1         1         1            1
hello-springboot     1         1         1            1
All the
deployment.yml
files that we used have a
replicas
value of
1
. This means we want
to have one pod/instance of our microservice running at all times. If a
pod dies (or gets deleted), then Kubernetes is charged with
reconciling the desired state for us, which is
replicas=1
. If the
cluster is not in the desired state, Kubernetes will take action to make
sure the desired configuration is satisfied. What happens if we want to
change the desired number of replicas and scale up our service?
$ oc scale deployment hello-springboot --replicas=3
deployment.extensions/hello-springboot scaled
Now if we list the pods, we should see three pods running our hello-springboot application:
$ oc get pods
NAME                                 READY     STATUS
api-gateway-76649cffc-dgr84          1/1       Running
backend-659d8c4cb9-5hv2r             1/1       Running
hello-microprofile-844c6c758-mmx4h   1/1       Running
hello-springboot-5bf5c4c7fd-j77lj    1/1       Running
hello-springboot-5bf5c4c7fd-ltv5p    1/1       Running
hello-springboot-5bf5c4c7fd-w4z7c    1/1       Running
If any of those pods dies or gets deleted, Kubernetes will do what it
needs to do to make sure the replica count for this service is 3. Notice also that we
didn’t have to change ports on these services or do any unnatural port
remapping. Each of the services is listening on port
8080
and does
not collide with the others.
Kubernetes also has the ability to do autoscaling by watching metrics like CPU, memory usage, or user-defined triggers and scaling the number of replicas up or down to suit. Autoscaling is outside the scope of this report but is a very valuable piece of the cluster management puzzle.
Service discovery
In Kubernetes, a
Service
is a simple abstraction that
provides a level of indirection between a group of pods and an
application using the service represented by that group of pods. We’ve
seen how pods are managed by Kubernetes and can come and go. We’ve also
seen how Kubernetes can easily scale up the number of instances of a
particular service. In our example, we deployed our
backend
service from the previous chapters to play the role of service provider.
How does our
hello-springboot
service communicate with that service?
Let’s take a look at what Kubernetes services exist:
$ oc get services
NAME                 TYPE        CLUSTER-IP       PORT(S)
api-gateway          ClusterIP   172.30.227.148   8080/TCP
backend              ClusterIP   172.30.169.193   8080/TCP
hello-microprofile   ClusterIP   172.30.31.211    8080/TCP
hello-springboot     ClusterIP   172.30.200.142   8080/TCP
The
CLUSTER-IP
is assigned when a
Service
object is created and never goes away. It’s a single, fixed IP address that is available to any applications running within the Kubernetes cluster and can be used to talk to
backend
pods. Take a look at the
service.yml
file for
backend
:
apiVersion:v1kind:Servicemetadata:name:backendlabels:app:backendbook:microservices4javadevspec:ports:-name:httpport:8080selector:app:backend
The pods are “selected” with the
selector
field. As we saw in
“Labels”
, pods in Kubernetes can be “labeled” with whatever metadata we want to apply (like “version” or “component” or “team”), and those labels can subsequently be used in the selector for a
Service
. In this example, we’re selecting all the pods with the label
app
=
backend
. This means any pods that have that label can be reached just by using the cluster IP. There’s no need for complicated distributed registries (e.g., ZooKeeper, Consul, or Eureka) or anything like that; it’s all built right into Kubernetes. Cluster-level DNS is also built into Kubernetes. Using DNS in general for microservice discovery can be very challenging, if not downright painful. In Kubernetes, the cluster DNS points to the cluster IP, and since the cluster IP is a fixed IP and doesn’t go away, there are no issues with DNS caching and other gremlins that can pop up with traditional DNS.
When we deployed our
hello-microprofile
and
hello-springboot
microservices, the
deployment.yml
files each declared an environment variable called
GREETING_BACKENDSERVICEHOST
with the value
backend
. That value matches the name of the backend service that we saw in the output of the command
oc get services
. This name was declared in the backend service’s
service.yml
file.
This environment value replaces the value that we declared in their
application.properites
file for our
hello-springboot
microservice (
greeting.backendServiceHost=localhost
; see
“Calling Another Service”
). In our
hello-microprofile
microservice, the value was declared using the annotation
@ConfigProperty(name = "greeting.backendServiceHost", defaultValue = "localhost")
(see
Example 3-5
).
Because we declared the name of the service and not the IP address, all it takes to find it is a little bit of DNS and the power of Kubernetes service discovery. One big thing to notice about this approach is that we did not specify any extra client libraries or set up any registries or anything. We happen to be using Java in this case, but using Kubernetes cluster DNS provides a technology-agnostic way of doing basic service discovery!
Fault Tolerance
Complex distributed systems like microservices architectures must be built with an important premise in mind: things will fail . We can spend a lot of energy trying to prevent failures, but even then we won’t be able to predict every case of where and how dependencies in a microservices environment can fail. A corollary to our premise that things will fail is therefore we must design our services for failure . Another way of saying that is that we need to figure out how to survive in an environment where there are failures.
Cluster Self-Healing
If a service begins to misbehave, how will we know about it? Ideally, you might think, our cluster management solution could detect and alert us about failures and let human intervention take over. This is the approach we typically take in traditional environments. But when running microservices at scale, where we have lots of services that are supposed to be identical, do we really want to have to stop and troubleshoot every possible thing that can go wrong with a service? Long-running services may experience unhealthy states. An easier approach is to design our microservices such that they can be terminated at any moment, especially when they appear to be behaving incorrectly.
Kubernetes has a couple of health probes we can use out of the box to allow the cluster to administer and self-heal itself. The first is a readiness probe, which allows Kubernetes to determine whether or not a pod should be considered in any service discovery or load-balancing algorithms. For example, some Java apps may take a few seconds to bootstrap the containerized process, even though the pod is technically up and running. If we start sending traffic to a pod in this state, users may experience failures or inconsistent states. With readiness probes, we can let Kubernetes query an HTTP endpoint (for example) and only consider the pod ready if it gets an HTTP 200 or some other response. If Kubernetes determines a pod does not become ready within a specified period of time, the pod will be killed and restarted.
Another health probe we can use is a liveness probe. This is similar to the readiness probe; however, it’s applicable after a pod has been determined to be “ready” and is eligible to receive traffic. Over the course of the life of a pod or service, if the liveness probe (which could also be a simple HTTP endpoint) starts to indicate an unhealthy state (e.g., HTTP 500 errors), Kubernetes can automatically kill the pod and restart it.
In the
deployment.yml
file shown earlier we declared both of these, with
livenessProbe
and
readinessProbe
:
livenessProbe:httpGet:# make an HTTP requestport:8080# port to usepath:/actuator/health# endpoint to hitscheme:HTTP# or HTTPS...readinessProbe:httpGet:# make an HTTP requestport:8080# port to usepath:/actuator/health# endpoint to hitscheme:HTTP# or HTTPS
This means the “readiness” of a hello-springboot pod will be determined by periodically polling the /actuator/health endpoint of the pod (the endpoint was added when we added the actuator to our Spring Boot microservice earlier). If the pod is ready, it returns:
{"status":"UP"}
The same thing can be done with MicroPorfile/Thorntail and Apache Camel.
Circuit Breaker
As a service provider, your responsibility is to your consumers to provide the functionality you’ve promised. Following promise theory, a service provider may depend on other services or downstream systems but cannot and should not impose requirements upon them. A service provider is wholly responsible for its promise to consumers. Because distributed systems can and do fail, however, there will be times when service promises can’t be met or can be only partly met. In our previous examples, we showed our “hello” microservices reaching out to a backend service to form a greeting at the /api/greeting endpoint. What happens if the backend service is not available? How do we hold up our end of the promise?
We need to be able to deal with these kinds of distributed systems faults. A service may not be available; a network may be experiencing intermittent connectivity; the backend service may be experiencing enough load to slow it down and introduce latency; a bug in the backend service may be causing application-level exceptions. If we don’t deal with these situations explicitly; we run the risk of degrading our own service; holding up threads, database locks, and resources, and contributing to rolling, cascading failures that can take an entire distributed network down. The following subsections present two different approaches to help us account for these failures (one for each technology, Spring Boot and MicroProfile).
Circuit breaker with MicroProfile
Let’s start with MicroProfile, by adding a
microprofile-fault-tolerance
dependency to our Maven
pom.xml
:
<dependency><groupId>io.thorntail</groupId><artifactId>microprofile-fault-tolerance</artifactId></dependency>
Now we can annotate our
greeting()
method with the annotations
@CircuitBreaker
and
@Timeout
. But if a backend dependency becomes latent or unavailable and MicroProfile
intervenes with a circuit breaker, how does our service keep its
promise? The answer to this may be very domain-specific. Consider our earlier example of a personalized book recommendation service. If this service isn’t available or is too slow to respond, the backend could default to sending a book list that’s not personalized. Maybe we’d send back a book list that’s generic for users in a particular region, or just a generic “list of the day.” To do this, we can use MicroProfile built-in
fallback()
method. In
Example 6-1
, we add a
fallback()
method to return a generic response if the
backend
service is not available. We also add the
@Fallback
annotation to our
GreeterRestController
class specifying the method to call if the greeting invocation fails, along with the
@Timeout
annotation to avoid the microservice waiting more than one second for a reply.
Example 6-1. src/main/java/com/example/hellomicroprofile/rest/GreeterRestController.java
@RestController@RequestMapping("/api")@ConfigurationProperties(prefix="greeting")publicclassGreeterRestController{// Not showing variables@GET@Produces("text/plain")@Path("greeting")@CircuitBreaker@Timeout@Fallback(fallbackMethod="fallback")publicStringgreeting(){// greeting implementation}publicStringfallback(){returnsaying+" at host "+System.getenv("HOSTNAME")+" - (fallback)";}}
Circuit breaker with Spring Boot
For Spring Boot, we will use a library from the NetflixOSS stack named Hystrix. This library is integrated with Spring through a Spring library called Spring Cloud.
Hystrix is a fault-tolerant Java library that allows microservices to hold up their end of a promise by:
-
Providing protection against dependencies that are unavailable
-
Monitoring and providing timeouts to guard against unexpected dependency latency
-
Load shedding and self-healing
-
Degrading gracefully
-
Monitoring failure states in real time
-
Injecting business logic and other stateful handling of faults
First, let’s add the
spring-cloud-starter-netflix-hystrix
dependency to our Maven
pom.xml
:
<dependency><groupId>org.springframework.cloud</groupId><artifactId>spring-cloud-starter-netflix-hystrix</artifactId><version>2.0.2.RELEASE</version></dependency>
In
Example 6-2
, we add the annotation
@HystricCommand
and the
fallback()
method to to the
GreeterRestController
class.
Example 6-2. src/main/java/com/example/GreeterRestController.java
@RestController@RequestMapping("/api")@ConfigurationProperties(prefix="greeting")publicclassGreeterRestController{// Not showing variables and setters@RequestMapping(value="/greeting",method=RequestMethod.GET,produces="text/plain")@HystrixCommand(fallbackMethod="fallback")publicStringgreeting(){StringbackendServiceUrl=String.format("http://%s:%d/api/backend?greeting={greeting}",backendServiceHost,backendServicePort);System.out.println("Sending to: "+backendServiceUrl);BackendDTOresponse=template.getForObject(backendServiceUrl,BackendDTO.class,saying);returnresponse.getGreeting()+" at host: "+response.getIp();}publicStringfallback(){returnsaying+" at host "+System.getenv("HOSTNAME")+" - (fallback)";}}
We also need to add one last annotation,
@EnableCircuitBreaker
as shown in
Example 6-3
; that’s necessary to tell Spring Cloud that the
hello-springboot
application uses circuit breakers and to enable their monitoring, opening, and closing (behavior supplied, in our case, by Hystrix).
Example 6-3. src/main/java/com/redhat/examples/hellospringboot/HelloSpringbootApplication
@EnableCircuitBreaker@SpringBootApplicationpublicclassHelloSpringbootApplication{publicstaticvoidmain(String[]args){SpringApplication.run(HelloSpringbootApplication.class,args);}}
Testing the circuit breaker
We know that both microservices ( hello-microprofile and hello-springboot ) depend on backend . What should be the expected behavior if we stop the backend application after we’ve made the latest modifications?
To test this behavior, we need to recreate the Docker image and restart the containers so the new image will be loaded.
If you want to build your own source code, navigate to the directory where your microservices are, create the Dockerfile as instructed in “Packaging Our Microservices as Docker Images” , and run the following commands to rebuild the Docker images:
$ cd <PROJECT_ROOT>/hello-springboot
$ mvn clean package
$ docker build -t rhdevelopers/hello-springboot:1.0 .

$ cd <PROJECT_ROOT>/hello-microprofile
$ mvn clean package
$ docker build -t rhdevelopers/hello-microprofile:1.0 .
Now that the images have been rebuilt, we can delete the previous running containers—Kubernetes will restart them using the new Docker images:
$ oc delete pod -l app=hello-springboot
$ oc delete pod -l app=hello-microprofile
We also need to scale the backend service to 0 replicas:
$ oc scale deployment backend --replicas=0
Now, we wait for all pods but the
backend
to be
Running
and try the
api-gateway
service to get the response from both microservices:
$ curl http://api-gateway-tutorial.$(minishift ip).nip.io
  /api/gateway
["Hello at host hello-
  microprofile-57c9f8f9f4-24c2l- (fallback)",
"Hello Spring Boot at host hello-
 springboot-f797878bd-24hxm- (fallback)"]
The response now shows that the
fallback()
methods in both microservicies were invoked because no communication with the
backend
service was possible.
The idea behind this contrived example is ubiquitous. However, the decision of whether to fall back, gracefully degrade, or break a promise is very domain-specific. For example, if you’re trying to transfer money in a banking application and a backend service is down, you may wish to reject the transfer, or you may wish to make only a certain part of the transfer available while the backend gets reconciled. Either way, there is no one-size-fits-all fallback method. In general, the ideal fallback solution is dependent on what kind of customer experience gets exposed and how best to gracefully degrade considering the domain.
Load Balancing
In a highly scaled distributed system, we need a way to discover and load balance against services in the cluster. As we’ve seen in previous examples, our microservices must be able to handle failures; therefore, we have to be able to load balance against services that exist, services that may be joining or leaving the cluster, or services that exist in an autoscaling group. Rudimentary approaches to load balancing, like round-robin DNS, are not adequate. We may also need sticky sessions, autoscaling, or more complex load-balancing algorithms. Let’s take a look at a few different ways of doing load balancing in a microservices environment.
Kubernetes Load Balancing
The great thing about Kubernetes is that it provides a lot of
distributed systems features out of the box; no need to add any extra
components (server side) or libraries (client side). Kubernetes
Service
s provided a means to discover microservices, and they also
provide server-side load balancing. If you recall, a Kubernetes
Service
is an abstraction over a group of pods that can be specified
with label selectors. For all the pods that can be selected with the
specified selector, Kubernetes will load balance any requests across
them. The default Kubernetes load-balancing algorithm is round robin, but it can be configured for other algorithms, such as session affinity. Note that clients don’t have to do anything to add a pod to the
Service
; just adding a label to your pod will enable it for selection and make it available. Clients reach the Kubernetes
Service
by using the cluster IP or cluster DNS service provided out of the box by Kubernetes. Also recall the cluster DNS service is not like traditional DNS and does not fall prey to the DNS caching TTL problems typically encountered with using DNS for discovery/load balancing. Furthermore, there are no hardware load balancers to configure or maintain; it’s all just built in.
To demonstrate load balancing, let’s scale up the backend services in our cluster and scale our hello-springboot service back to one replica to reduce the resource usage:
$ oc scale deployment hello-springboot --replicas=1
deployment.extensions/hello-springboot scaled

$ oc scale deployment backend --replicas=3
deployment.extensions "backend" scaled
Now if we check our pods, we should see three backend pods:
$ oc get pods
NAME                                  READY     STATUS
api-gateway-9786d4977-2jnfm           1/1       Running
backend-859bbd5cc-ck68q               1/1       Running
backend-859bbd5cc-j46gj               1/1       Running
backend-859bbd5cc-mdvcs               1/1       Running
hello-microprofile-57c9f8f9f4-24c2l   1/1       Running
hello-springboot-f797878bd-24hxm      1/1       Running
If we describe the Kubernetes services
backend
, we should see the the selector used to select the pods that
will be eligible for taking requests. The
Service
will load balance to
the pods listed in the
Endpoints
field:
$ oc describe service backend
Name:              backend
Namespace:         microservices4java
Labels:            app=backend
Annotations:       <none>
Selector:          app=backend
Type:              ClusterIP
IP:                172.30.169.193
Port:              http  8080/TCP
TargetPort:        8080/TCP
Endpoints:         172.17.0.11:8080,172.17.0.13:8080,
                   172.17.0.14:8080
Session Affinity:  None
Events:            <none>
We can see here that the
backend
service will select all pods with
the label
app=backend
. Let’s take a
moment to see what labels are on one of the
backend
pods:
$ oc describe pod/backend-859bbd5cc-ck68q | grep Labels
Labels:                     app=backend
The backend pods have a label that matches what the service is looking for, so any communication with the service will be load-balanced over these matching pods.
Let’s make a few calls to our api-gateway service. We should see the responses contain different IP addresses for the backend service:
$ curl http://api-gateway-tutorial.$(minishift ip).nip.io
  /api/gateway
 ["Hello from cluster Backend at host: 172.17.0.11",
 "Hello Spring Boot from cluster Backend at host: 172.17.0.14"]

$ curl http://api-gateway-tutorial.$(minishift ip).nip.io
  /api/gateway
 ["Hello from cluster Backend at host: 172.17.0.13",
"Hello Spring Boot from cluster Backend at host: 172.17.0.14"]
We used
curl
here, but
you can use your favorite HTTP/REST tool, including your web browser.
Just refresh your browser a few times; you should see that the backend that
gets called is different each time, indicating that the Kubernetes
Service
is load
balancing over the respective pods as expected.
When you’re done experimenting, don’t forget to reduce the number of replicas in your cluster to reduce the resource consumption:
$ oc scale deployment backend --replicas=1
deployment.extensions/backend scaled
Where to Look Next
In this chapter, you learned a little about the pains of deploying and managing microservices at scale and how Linux containers can help. We can leverage true immutable delivery to reduce configuration drift, and we can use Linux containers to enable service isolation, rapid delivery, and portability. We can leverage scalable container management systems like Kubernetes features that are built in, such as service discovery, failover, health-checking, and much more. You don’t need complicated port swizzling or complex service discovery systems when deploying on Kubernetes because these are problems that have been solved within the infrastructure itself. To learn more, please review the following resources:
Chapter 7. Distributed Tracing with OpenTracing
In the previous chapters, we built a couple of microservices that connect to a backend. To access these two microservices, we also built an API Gateway. With just a few microservices, it’s easy to understand the topology and what calls what inside our cluster. However, in a real-world scenario the network of services will likely be far more complex, and therefore it will be much more complex to monitor the number of requests, the response time, and the path of a particular invocation. A simple invocation can traverse several microservices, and any particular issue will be hard to detect if we don’t have the ability to trace those invocations.
One things that we need to keep in mind is that distributed tracing should be technology-agnostic, because a Java microservice might invoke a .NET microservice that will call a Python microservice, and they should all accept and propagate the tracing information.
In 2010, Google published a paper about the project Dapper , which was designed to provide a solution for distributed tracing. This paper influenced several open source implementations, like Zipkin and Appdash. In 2015 the OpenTracing project was started, and in 2016 it became a hosted project of the Cloud Native Computing Foundation (CNCF).
OpenTracing is comprised of a set of standard APIs and a vendor-neutral framework for instrumentation. It supports the following platforms: Go, JavaScript, Java, Python, Ruby, PHP, Objective-C, C++ , and C#. There are already several OpenTracing implementations, including Jaeger (from Uber), Apache Skywalking, and Instana, and others. In this report, we will use Jaeger, which is the most widely used implementation of OpenTracing.
Installing Jaeger
All information captured on each microservice should be reported to a server that will collect and store this information, so it can be queried later.
So, before instrumenting the source code of our microservices, first we need to install the Jaeger server and its components. Jaeger provides an all-in-one distribution composed of the Jaeger UI, collector, query, and agent, with an in-memory storage component.
We can install this distribution with the following command:
$ oc process -f \
http://raw.githubusercontent.com/jaegertracing/jaeger-openshift
/master/
all-in-one/jaeger-all-in-one-template.yml | oc create -f -

deployment.extensions "jaeger" created
service "jaeger-query" created
service "jaeger-collector" created
service "jaeger-agent" created
service "zipkin" created
route.route.openshift.io "jaeger-query" created
That’s it! Now we can start modifying our microservices to report the tracing information to this server.
Modifying Microservices for Distributed Tracing
Now that we have our Jaeger server installed, it’s time to modify our microservices to report information to it.
All Java OpenTracing libraries can be configured using
environment variables
. The only environment variable that is required is
JAEGER_SERVICE_NAME
, which tells Jaeger the name of the service. This will be declared as an
ENV
instruction in each microservice’s Dockerfile. Because we will also need other environment variables on all microservices to configure the tracing collector, they will be declared using a Kubernetes feature called a
ConfigMap
, and then will be consumed by all the microservices.
Modifying the API gateway
The first microservice that we will modify is the
api-gateway
service. Since it was built using Camel, we will make use of a Camel component called
camel-opentracing
. This component is used for tracing incoming and outcoming Camel messages.
To use this Camel component, we just need to add the dependency
camel-opentracing-starter
that enables the integration of Camel, Spring Boot, and OpenTracing to our
pom.xml
file. We will also need to add two Jaeger libraries--
jaeger-tracerresolver
gets the
Tracer
object and configures it from environment variables, and
jaeger-thrift
is a set of components that send data to the backend:
<!-- OpenTracing --><dependency><groupId>org.apache.camel</groupId><artifactId>camel-opentracing-starter</artifactId></dependency><dependency><groupId>io.jaegertracing</groupId><artifactId>jaeger-tracerresolver</artifactId><version>0.32.0</version></dependency><dependency><groupId>io.jaegertracing</groupId><artifactId>jaeger-thrift</artifactId><version>0.32.0</version></dependency>
Now we can “turn on” the OpenTracing feature by annotating the main class with
@CamelOpenTracing
as shown in
Example 7-1
.
Example 7-1. src/main/java/com/redhat/examples/MySpringBootApplication.java
@SpringBootApplication@CamelOpenTracingpublicclassMySpringBootApplication{/*** A main method to start this application.*/publicstaticvoidmain(String[]args){SpringApplication.run(MySpringBootApplication.class,args);}}
As mentioned previously, the Tracer object will be configured using several environment variables. Because the only one that is required is
JAEGER_SERVICE_NAME
, we will add this to our Dockerfile with the value
API-Gateway
:
FROMfabric8/java-alpine-openjdk8-jdkENVJAVA_APP_JAR api-gateway-1.0.jarENVAB_OFF trueENVJAEGER_SERVICE_NAME API-GatewayADDtarget/api-gateway-1.0.jar /deployments/
Now we can rebuild the JAR file and the Docker image and restart the Kubernetes pod with the following commands:
$ mvn clean package
$ docker build -t rhdevelopers/api-gateway:1.0 .
$ oc delete pod -l app=api-gateway
Modifying the Spring Boot microservice
For our
hello_springboot
microservice, we need to add the same
jaeger-tracerresolver
and
jaeger-thrift
libraries that we included in the
api-gateway
service, plus the
opentracing-spring-web-starter
dependency that will be responsible for providing the integration with Spring Boot and OpenTracing:
<!-- OpenTracing --><dependency><groupId>io.opentracing.contrib</groupId><artifactId>opentracing-spring-web-starter</artifactId><version>1.0.1</version></dependency><dependency><groupId>io.jaegertracing</groupId><artifactId>jaeger-tracerresolver</artifactId><version>0.32.0</version></dependency><dependency><groupId>io.jaegertracing</groupId><artifactId>jaeger-thrift</artifactId><version>0.32.0</version></dependency>
To enable the tracing headers to be forwarded from this microservice to the backend, the
RestTemplate
needs an interceptor called
TracingRestTemplateInterceptor
.
Let’s modify the
GreeterRestController
class to add this interceptor, as shown in
Example 7-2
.
Example 7-2. src/main/java/com/redhat/examples/hellospringboot/GreeterRestController.java
@RestController@RequestMapping("/api")@ConfigurationProperties(prefix="greeting")publicclassGreeterRestController{privateRestTemplatetemplate=newRestTemplate();privateStringsaying,backendServiceHost;privateintbackendServicePort;@RequestMapping(value="/greeting",method=RequestMethod.GET,produces="text/plain")@HystrixCommand(fallbackMethod="fallback")publicStringgreeting(){template.setInterceptors(Collections.singletonList(newTracingRestTemplateInterceptor(TracerResolver.resolveTracer())));StringbackendServiceUrl=String.format("http://%s:%d/api/backend?greeting={greeting}",backendServiceHost,backendServicePort);System.out.println("Sending to: "+backendServiceUrl);BackendDTOresponse=template.getForObject(backendServiceUrl,BackendDTO.class,saying);returnresponse.getGreeting()+" at host: "+response.getIp();}//fallback method and setters}
Now let’s add the declaration of the
JAEGER_SERVICE_NAME
environment variable in the Dockerfile:
FROMfabric8/java-alpine-openjdk8-jdkENVJAVA_APP_JAR hello-springboot-1.0.jarENVAB_OFF trueENVJAEGER_SERVICE_NAME hello-springbootADDtarget/hello-springboot-1.0.jar /deployments/
Then we can rebuild the JAR file and the Docker image and restart the Kubernetes pod with the following commands:
$ mvn clean package -DskipTests
$ docker build -t rhdevelopers/hello-springboot:1.0 .
$ oc delete pod -l app=hello-springboot
Modifying the MicroProfile microservice
For our hello_microprofile , we will follow the same recipe:
-
Add a Maven dependency.
-
Modify the source code.
-
Add the
JAEGER_SERVICE_NAMEenvironment variable to the Dockerfile.
Let’s start by adding the Maven dependencies related to OpenTracing and Jaeger, respectively. MicroProfile has support for OpenTracing and Thorntail has integration with Jaeger, so we will need both dependencies:
<!-- OpenTracing --><dependency><groupId>io.thorntail</groupId><artifactId>microprofile-opentracing</artifactId></dependency><dependency><groupId>io.thorntail</groupId><artifactId>jaeger</artifactId></dependency>
MicroProfile has an API for accessing an OpenTracing-compliant
Tracer
object within a JAX-RS application. We just need to add the
@Traced
annotation to the methods that will be “traced.” We also need to use the class
ClientTracingRegistrar
to configure tracing features into the JAX-RS client. Let’s perform these modifications to the
greeting()
method in the
GreeterRestController
class in
Example 7-3
.
Example 7-3. src/main/java/com/redhat/examples/hellomicroprofile/rest/GreeterRestController.java
@Path("/api")publicclassGreeterRestController{@Inject@ConfigProperty(name="greeting.saying",defaultValue="Hello")privateStringsaying;@Inject@ConfigProperty(name="greeting.backendServiceHost",defaultValue="localhost")privateStringbackendServiceHost;@Inject@ConfigProperty(name="greeting.backendServicePort",defaultValue="8080")privateintbackendServicePort;@GET@Produces("text/plain")@Path("greeting")@CircuitBreaker@Timeout@Fallback(fallbackMethod="fallback")@Traced(operationName="greeting")publicStringgreeting(){StringbackendServiceUrl=String.format("http://%s:%d",backendServiceHost,backendServicePort);System.out.println("Sending to: "+backendServiceUrl);Clientclient=ClientTracingRegistrar.configure(ClientBuilder.newBuilder()).build();BackendDTObackendDTO=client.target(backendServiceUrl).path("api").path("backend").queryParam("greeting",saying).request(MediaType.APPLICATION_JSON_TYPE).get(BackendDTO.class);returnbackendDTO.getGreeting()+" at host: "+backendDTO.getIp();}publicStringfallback(){returnsaying+" at host "+System.getenv("HOSTNAME")+" - (fallback)";}}
That’s it! Just one annotation and we are good to go. But let’s not forget about the
JAEGER_SERVICE_NAME
in the Dockerfile:
FROMfabric8/java-alpine-openjdk8-jdkENVJAVA_APP_JAR demo-thorntail.jarENVAB_OFF trueENVJAEGER_SERVICE_NAME hello-microprofileADDtarget/demo-thorntail.jar /deployments/
We can then rebuild the JAR file and the Docker image and restart the Kubernetes pod with the following commands:
$ mvn clean package -DskipTests
$ docker build -t rhdevelopers/hello-microprofile:1.0 .
$ oc delete pod -l app=hello-microprofile
Modifying the Servlet backend
Finally, we will add tracing capabilities to our
backend
application. To make this happen, we will add the dependency
jaeger-client
to our
pom.xml
file:
<!-- OpenTracing --><dependency><groupId>io.jaegertracing</groupId><artifactId>jaeger-client</artifactId><version>0.32.0</version></dependency>
With this library, the backend application using OpenTracing’s
TracerResolver
can continue using the Jaeger Java client without any hardcoded dependency; we can configure it via environment variables just like we did for the previous microservice.
On the source code side, it will require a little bit more work as we need to extract the parent
Span
coming from the microservice’s request headers and create a new child
Span
. This can be done using the following code snippet:
//Extract the parent Span from the headersSpanContextparentSpan=tracer.extract(Format.Builtin.HTTP_HEADERS,newTextMapExtractAdapter(headers));//Start a new Span as a child of the Parent SpanScopescope=tracer.buildSpan("backend-servlet").asChildOf(parentSpan).startActive(true);//Perform workscope.span().finish();
Example 7-4
shows the necessary modifications in the
BackendHttpServlet
class.
Example 7-4. src/main/java/com/redhat/examples/backend/BackendHttpServlet.java
@WebServlet(urlPatterns={"/api/backend"})publicclassBackendHttpServletextendsHttpServlet{privateTracertracer=TracerResolver.resolveTracer();@OverrideprotectedvoiddoGet(HttpServletRequestreq,HttpServletResponseresp)throwsServletException,IOException{//Place the HTTP headers in a HashMapfinalHashMap<String,String>headers=newHashMap<>();Enumeration<String>headerNames=req.getHeaderNames();while(headerNames.hasMoreElements()){Stringname=headerNames.nextElement();Stringvalue=req.getHeader(name);headers.put(name,value);}//Extract the parent Span from the headersSpanContextparentSpan=tracer.extract(Format.Builtin.HTTP_HEADERS,newTextMapExtractAdapter(headers));//Start a new Span as a child of the parent SpanScopescope=tracer.buildSpan("backend-servlet").asChildOf(parentSpan).startActive(true);resp.setContentType("application/json");ObjectMappermapper=newObjectMapper();Stringgreeting=req.getParameter("greeting");ResponseDTOresponse=newResponseDTO();response.setGreeting(greeting+" from cluster Backend");response.setTime(System.currentTimeMillis());response.setIp(getIp());PrintWriterout=resp.getWriter();mapper.writerWithDefaultPrettyPrinter().writeValue(out,response);scope.span().finish();}privateStringgetIp(){Stringhostname=null;try{hostname=InetAddress.getLocalHost().getHostAddress();}catch(UnknownHostExceptione){hostname="unknown";}returnhostname;}}
We must also to add the declaration of the
JAEGER_SERVICE_NAME
environment variable in the Dockerfile:
FROMjboss/wildfly:10.0.0.FinalENVJAEGER_SERVICE_NAME backendADDtarget/ROOT.war /opt/jboss/wildfly/standalone/deployments/
Now we can rebuild the JAR file and the Docker image and restart the Kubernetes pod with the following commands:
$ mvn clean package -DskipTests
$ docker build -t rhdevelopers/backend:1.0 .
$ oc delete pod -l app=backend
Configuring Microservices Using ConfigMap
As we discussed previously, the configuration of Jaeger Java clients is done through environment variables. In any case, the only environment variable that is required is
JAEGER_SERVICE_NAME
, which we defined in every Dockerfile.
If you look at the logs of any microservices, you should see a message like the following:
Initializedtracer=JaegerTracer(version=Java-0.32.0,serviceName=API-Gateway,reporter=RemoteReporter(sender=UdpSender(),closeEnqueueTimeout=1000),sampler=RemoteControlledSampler(maxOperations=2000,manager=HttpSamplingManager(hostPort=localhost:5778),sampler=ProbabilisticSampler(tags={sampler.type=probabilistic, sampler.param=0.001})), ...
This means that the default configuration for the tracer uses a
UDP Sender
that sends the tracing information to
localhost:5778
. The
ProbabilisticSampler
defines that only 0.1% (0.001) of the requests will be traced. Tracing only 0.1% of the requests seems fine for production usage. However, for our tutorial we will change the tracer to collect all requests.
According to the environment variable definitions in the
jaeger-core
module, we will need to configure the following keys/values for all microservices:
-
JAEGER_ENDPOINT: http://jaeger-collector:14268/api/traces -
JAEGER_REPORTER_LOG_SPANS: true -
JAEGER_SAMPLER_TYPE: const -
JAEGER_SAMPLER_PARAM: 1
These environment variables configure the tracer to send an HTTP report to http://jaeger-collector:14268/api/traces . Every tracer report will be logged, and we will use a constant sampler that collects 100% of the requests (1 of 1).
We could use the command
oc set env
for every microservice, but we want to try something more advanced. We will create a
Configmap
Kubernetes object to hold this configuration. Later we will consume the configurations using environment variables, but don’t worry about the details right now.
$ oc set env deployment --all --from=configmap/jaeger-config
deployment.extensions/api-gateway updated
deployment.extensions/backend updated
deployment.extensions/hello-microprofile updated
deployment.extensions/hello-springboot updated
deployment.extensions/jaeger updated
Note that it will cause the deployment of every microservice and that the logs now for any microservice will contain different information about the tracer:
Initializedtracer=JaegerTracer(version=Java-0.32.0,serviceName=API-Gateway,reporter=CompositeReporter(reporters=[RemoteReporter(sender=HttpSender(),closeEnqueueTimeout=1000), LoggingReporter(...sampler=ConstSampler(decision=true,tags={sampler.type=const, sampler.param=true}),tags={hostname=api-gateway-78f6f8dcd7-wckvx, jaeger.version=Java-0.32.0,ip=172.17.0.16}, ...
Wait for the pods to come alive, and try making a request to the microservice:
$ curl http://api-gateway-tutorial.$(minishift ip).nip.io
  /api/gateway
["Hello from cluster Backend at host: 172.17.0.13",
 "Hello Spring Boot from cluster Backend at host: 172.17.0.13"]
You should see something like this in the logs:
i.j.internal.reporters.LoggingReporter
: Span reported: d716584c2fab233d:d716584c2fab233d:0:1
Analyzing the Tracing in Jaeger
Now that we’ve made a request using the
curl
command, and we’ve seen in the logs that this request generated a tracer
Span
that was reported to Jaeger, we can open the Jaeger UI to look at some important information. To open the UI in your browser, use the following command:
$ minishift openshift service jaeger-query --in-browser
In the top menu, select Dependencies, and then select DAG. Note that the generated dependency graph is similar to what we expected (
Figure 7-1
from Jaeger and
Figure 7-2
from our architecture show the same pattern). The number
1
in the Jaeger DAG indicates the number of requests between the microservices.
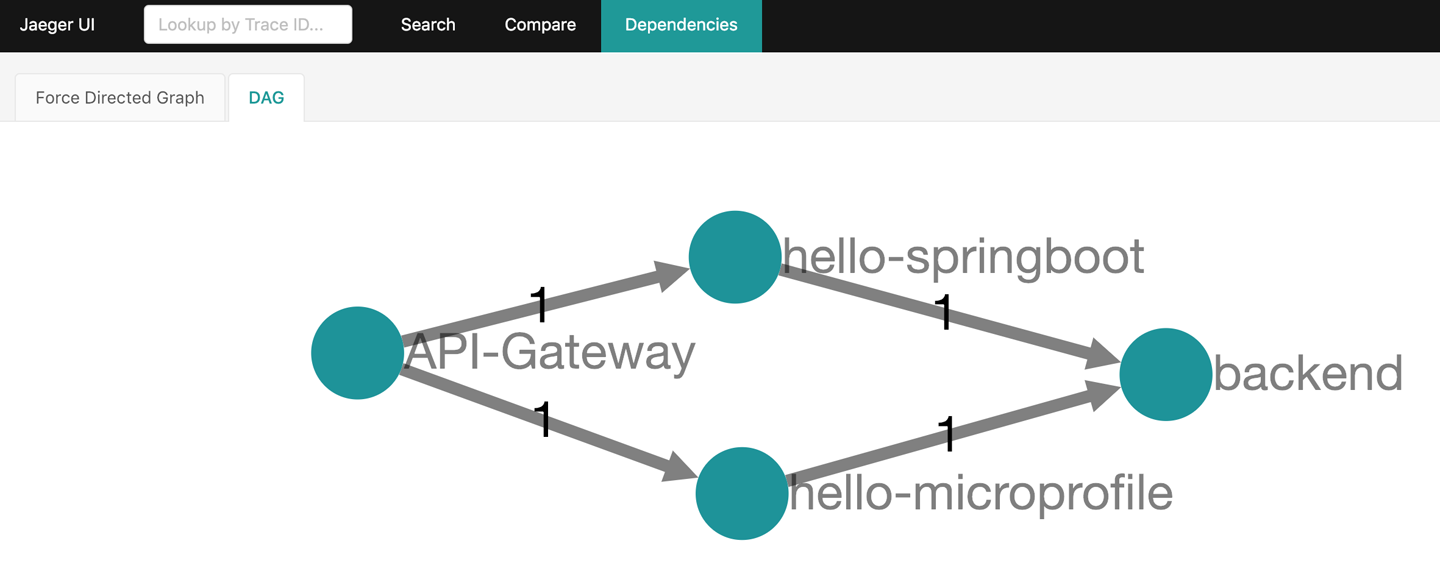
Figure 7-1. Jaeger dependencies
Figure 7-2. Calling another service
Now click Search in the top menu, and select the
API-Gateway
service. Scroll down the page, and click the Find Traces button. You should see the tracing generated by your request with the
curl
command, as shown in
Figure 7-3
.

Figure 7-3. Jaeger tracing
Click on the trace, and Jaeger will open the details. It’s easy to see that the
api-gateway
service made parallel requests to
hello-microprofile
and
hello-springboot
. You can click on the details of each
Span
to verify the path walked by the request inside the Camel routes until it reached the microservice.
Figure 7-4
shows the
Span
details.

Figure 7-4. Span details
Feel free to go ahead and search for the backend service spans.
Where to Look Next
In this chapter, you learned about distributed tracing, the CNCF OpenTracing specification, and the Jaeger implementation. You also learned how to instrument different technologies to collect and report tracing information, and learned how to use
ConfigMap
s to store and spread the configuration. Tracing is a complex subject, and we just covered the basics without going deeper into how the tracing happens. Check out the following links for more information:
Chapter 8. Where Do We Go from Here?
We have covered a lot in this report, but we certainly didn’t cover everything! Keep in mind we are just scratching the surface here, and there are many more things to consider in a microservices environment than what we could explore in this report. In this final chapter, we’ll very briefly talk about a couple of additional concepts you should be aware of. We’ll leave it as an exercise for the reader to dig into more detail for each section!
Configuration
Configuration is a very important part of any distributed system, and it becomes even more difficult with microservices. We need to find a good balance between configuration and immutable delivery because we don’t want to end up with snowflake services. For example, we’ll need to be able to change logging, switch on features for A/B testing, configure database connections, and use secret keys or passwords. We saw in some of our examples how to configure our microservices using each of the three Java frameworks presented here, but each framework does configuration slightly differently. What if we have microservices written in Python, Scala, Golang, Node.js, etc.?
To be able to manage configuration across technologies and within
containers, we need to adopt an approach that works regardless of what’s
actually running in the containers. In a Docker environment, we can inject
environment variables and allow our application to consume those
environment variables. Kubernetes allows us to do that as well, and
considers it a good practice. Kubernetes also includes APIs for mounting
Secret
s that allow us to safely decouple usernames, passwords, and private keys from our applications and inject them into the Linux container when needed. Furthermore, the recently added
ConfigMap
s, which are very similar to
Secret
s in that they allow application-level configuration to be managed and decoupled from the application’s Docker image, and also allow us to inject configuration via environment variables and/or files on the
container’s filesystem. If an application can consume configuration
files from the filesystem (which we saw with all three Java frameworks)
or read environment variables, it can leverage the Kubernetes configuration
functionality. Taking this approach, we don’t have to set up additional
configuration services and complex clients for consuming it.
Configuration for our microservices running inside containers (or even
outside them), regardless of technology, is now baked into the cluster
management infrastructure.
Logging and Metrics
Without a doubt, a lot of the drawbacks to implementing a microservices architecture revolve around management of the services in terms of logging, metrics, and tracing. The more you break a system into individual parts, the more tooling, forethought, and insight you need to see the big picture. When you run services at scale, especially assuming a model where things fail, you need a way to grab information about services and correlate that with other data (like metrics and tracing), regardless of whether the containers are still alive. There are a handful of approaches to consider when devising your logging and metrics strategy:
-
Developers exposing their logs
-
Aggregation/centralization
-
Searching and correlating
-
Visualizing and charting
Kubernetes has add-ons to enable cluster-wide logging and metrics collection for microservices. Typical technologies for solving these issues include syslog, Fluentd, or Logstash for getting logs out of services and streaming them to a centralized aggregator. Some folks use messaging solutions to provide some reliability for these logs if needed. ElasticSearch is an excellent choice for aggregating logs in a central, scalable, searchable index, and if you layer Kibana on top, you get nice dashboards and search UIs. Other tools, like Prometheus, Jaeger, Grafana, Hawkular, Netflix Servo, and many others, should be considered as well.
Continuous Delivery
Deploying microservices with immutable images, as discussed earlier in Chapter 5 , is paramount. When we have many more (if smaller) services than before, our existing manual processes will not scale. Moreover, with each team owning and operating their own microservices, we need a way for teams to make immutable delivery a reality without bottlenecks and human error. Once we release our microservices, we need to have insight and feedback about their usage to help drive further change. As the business requests change, and as we get more feedback loops into the system, we will be doing more releases more often. To make this a reality, we need a capable software delivery pipeline. This pipeline may be composed of multiple subpipelines with gates and promotion steps, but ideally, we want to automate the build, test, and deploy mechanics as much as possible.
Tools like Docker and Kubernetes also give us the built-in capacity to implement rolling upgrades, blue-green deployments, canary releases, and other deployment strategies. Obviously these tools are not required to deploy in this manner (places like Amazon and Netflix have done it for years without Linux containers), but the inception of containers does give us the isolation and immutability factors to make this easier. You can use your CI/CD tooling, like Jenkins and Jenkins Pipeline, in conjunction with Kubernetes and build out flexible yet powerful build and deployment pipelines. Take a look at OpenShift for more details on an implementation of CI/CD with Kubernetes based on Jenkins Pipeline.
Summary
This report was meant as a hands-on, step-by-step guide for getting started with building distributed systems with some popular Java frameworks following a microservices approach. Microservices is not a technology-only solution, as we discussed in the opening chapter. People are the most important part of a complex system (a business), and to scale and stay agile, you must consider scaling the organizational structure as well as the technology systems involved.
After building microservices with whatever Java framework you choose, you need to build, deploy, and manage them. Doing this at scale using traditional techniques and primitives is overly complex, costly, and does not scale. Fortunately, we can turn to new technologies like Docker and Kubernetes that can help us build, deploy, and operate while following best practices like immutable delivery.
When getting started with microservices built and deployed in Docker and managed by Kubernetes, it helps to have a local environment used for development purposes. For this we recommend the Red Hat Container Development Kit, which is a small, local VM that has Red Hat OpenShift running inside a free edition of Red Hat Enterprise Linux (RHEL). OpenShift provides a production-ready Kubernetes distribution, and RHEL is a popular, secure, supported operating system for running production workloads. This allows you to develop applications using the same technologies that will be running in production and take advantage of the application packaging and portability provided by Linux containers.
We’ve touched on a few additional important concepts to keep in mind here, like configuration, logging, metrics, and continuous, automated delivery. We didn’t touch on security, self-service, and countless other topics, but make no mistake: they are very much a part of the microservices story.
We hope you’ve found this report useful. Please follow @openshift, @kubernetesio, @rhdevelopers, @rafabene, @christianposta, and @RedHat on Twitter for more information, and take a look at the source code repository .
Figure 1-1. Social influence